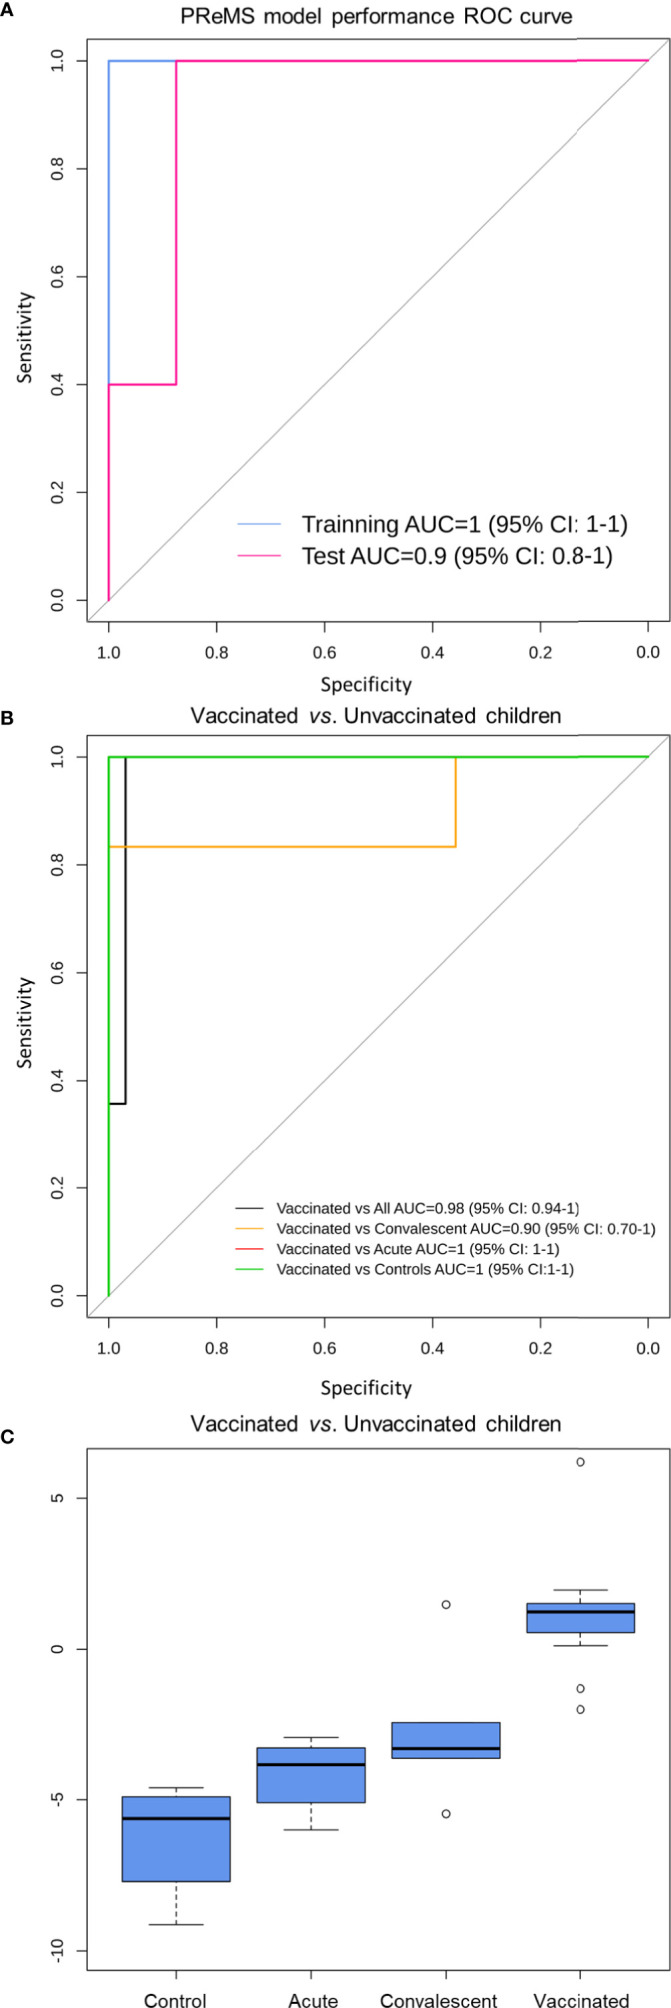
Figure 6.

Classification performance to distinguish RV5 vaccinated group from control children based on a nine-transcript model. (A) ROC curve of the model to distinguish between vaccinated and unvaccinated children (including healthy controls, RV acute and convalescent children). The blue curve corresponds to the training set whereas the pink curve to the test set. (B) ROC curve of the model to distinguish between vaccinated, controls and convalescent children (note that some curves overlap). (C) Box and whisker plot of the model: the horizontal lines in the boxes indicate the median of each group; the lower and upper edges of boxes reflect interquartile ranges, and the whiskers are <1 times the interquartile range. Total score value from nine-transcript signature calculated as in (34–36) is represented in the y-axis.
