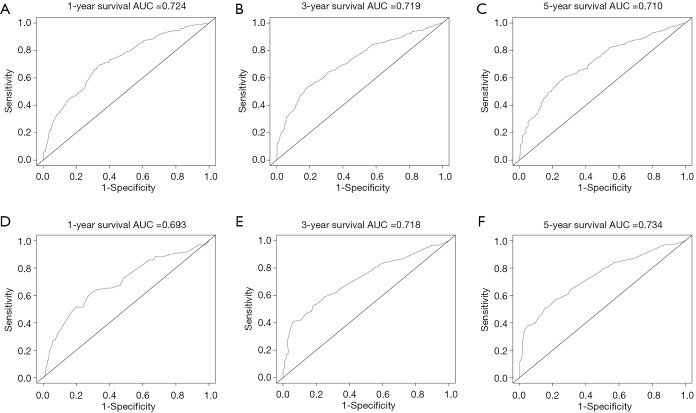
Figure 4.
AUC values and ROC curves of the nomogram for the predicted 1-, 3-, and 5-year OS rates for the training cohort (A,B,C) and the internal validation cohort (D,E,F). The X-axis represents the nomogram-predicted OS probability. AUC, area under the curve; ROC, receiver operating characteristic; OS, overall survival.

