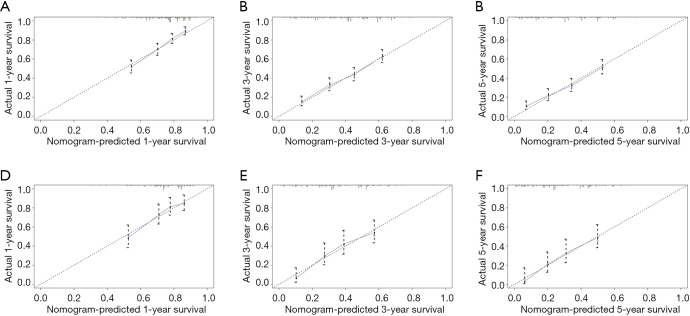
Figure 5.
Calibration graphs of the nomogram for the predicted 1-, 3-, and 5-year OS rates for the training cohort (A,B,C) and the internal validation cohort (D,E,F). The X-axis represents the nomogram-predicted OS probability. The Y-axis represents the actually observed OS probability. Diagonal lines represent the ideal nomogram reference. Striped dots represent the nomogram-predicted probability with the 95% CI. OS, overall survival; CI, confidence interval.

