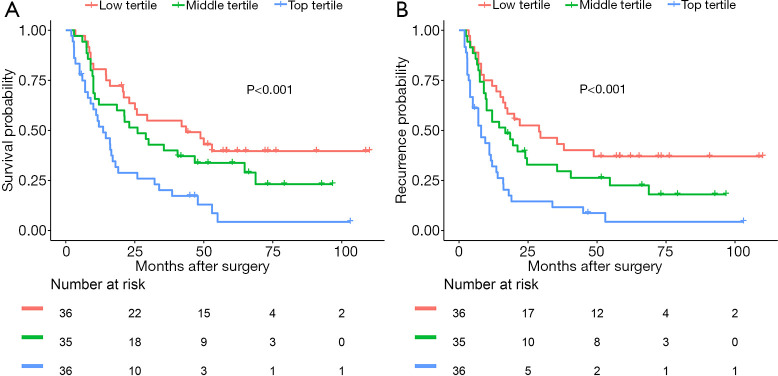
Figure 2.
Kaplan-Meier survival curves of OS and TTR. (A) The proportion of survival over time was highest in low tertiles and lowest in top tertiles; (B) the proportion of tumor recurrence over time was highest in low tertiles and lowest in top tertiles. OS, overall survival; TTR, time to recurrence.

