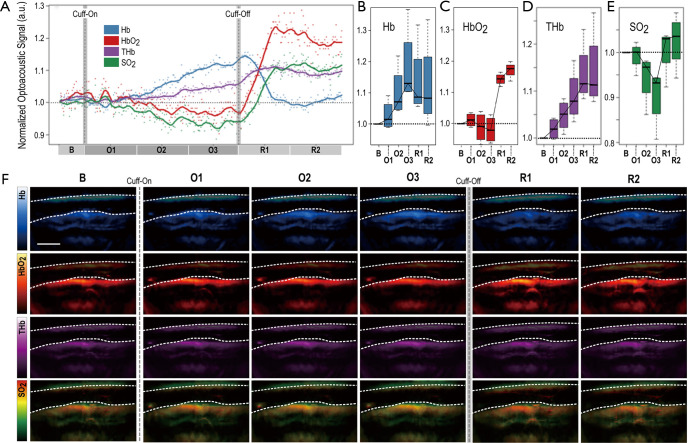
Figure 2.
Cuff-induced arterial occlusion measurements. (A). Exemplary plots of Hb (deoxygenated hemoglobin), HbO2 (oxygenated hemoglobin), THb (total hemoglobin) and SO2 (oxygen saturation) within the calf skeletal muscle of a healthy volunteer. The blue line represents the Hb changes, the red line represents the HbO2 changes, the purple line the THb changes and the green line the SO2 changes over time. All three lines were normalized to their respective baseline values. B is the baseline period (30 s before the cuff inflation), O1 is the first 60 s of cuff occlusion, O2 is the next 60 s of cuff occlusion, O3 is the last 60 s of cuff occlusion, R1 is the first 60 s after cuff deflation and R2 is the next 60 s after the deflation of the cuff. Statistics for changes of (B) Hb, (C) HbO2, (D) THb and (E) SO2 within the calf muscles of all (n1=4) healthy volunteers for each time period described in (A). For the panels (B,C,D,E), a subject is represented within the box of each time period by the average value of the plotted parameter during the specific time period. The images in (F) show the changes of intramuscular Hb (1st line), HbO2 (2nd line), THb (3rd line) and SO2 (4th line) distribution for the same time periods and subject as in (A). Each image represents the last second of the corresponding time period. The color bars represent the range of the values for a specific parameter for the whole set of the depicted images (the maximum value is the maximum of the set of all image maxima, the minimum value is the minimum of the set of all image minima). Upper white dashed line: skin surface. Lower white dashed line: interface between subcutaneous fat and muscle or else muscle line. Muscle area: Image area below the muscle line. For all images, the intensity of the area above the muscle has been lightly suppressed for visualization purposes. The scale bar is 1 cm.

