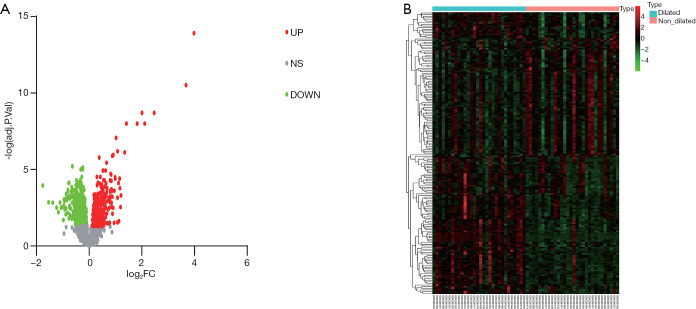
Figure 2.
Patterns of DE transcripts and DEGs. (A) The volcano plot showed the number of DE transcripts. The red dots represent the up-regulated transcripts while the green dots represent the down-regulated transcripts. (B) The heatmap showed the expression patterns of DEGs between dilated PVAT samples and non-dilated PVAT samples. DE, differentially expressed; DEG, differentially expressed gene; PVAT, perivascular adipose tissue.

