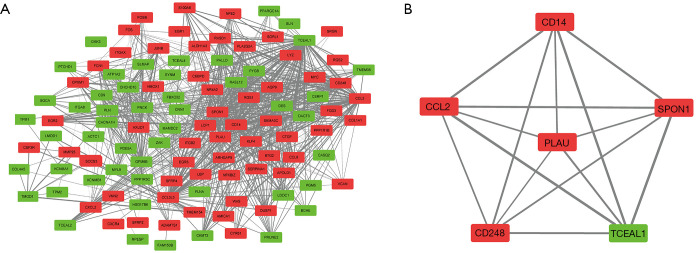
Figure 6.
DEG co-expression network and crucial gene cluster. (A) The DEGs co-expression network with 112 nodes and 953 edges were generated. The red box represents the up-regulated genes and the green box represents the down-regulated genes. (B) Crucial genes with top-6 degree were visualized. DEG, differentially expressed gene.

