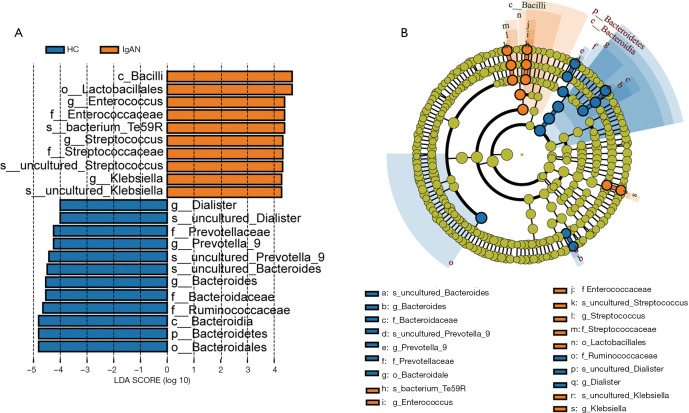
Figure 2.
Linear discriminant analysis (LDA) is integrated with effect size. (A) Differences in the relative abundance of bacteria in healthy control (HC) and immunoglobulin A nephropathy (IgAN) groups. (B) Cladogram of the phylogenetic distribution of microbes. Each circle represents a classification level from phylum to species from the inner to outer circles. The size of each circle is proportional to relative abundance. Microbes with no significant difference in abundance are shown in green. Microbes with an LDA value >4 in IgAN and HC groups are marked with orange and blue, respectively.

