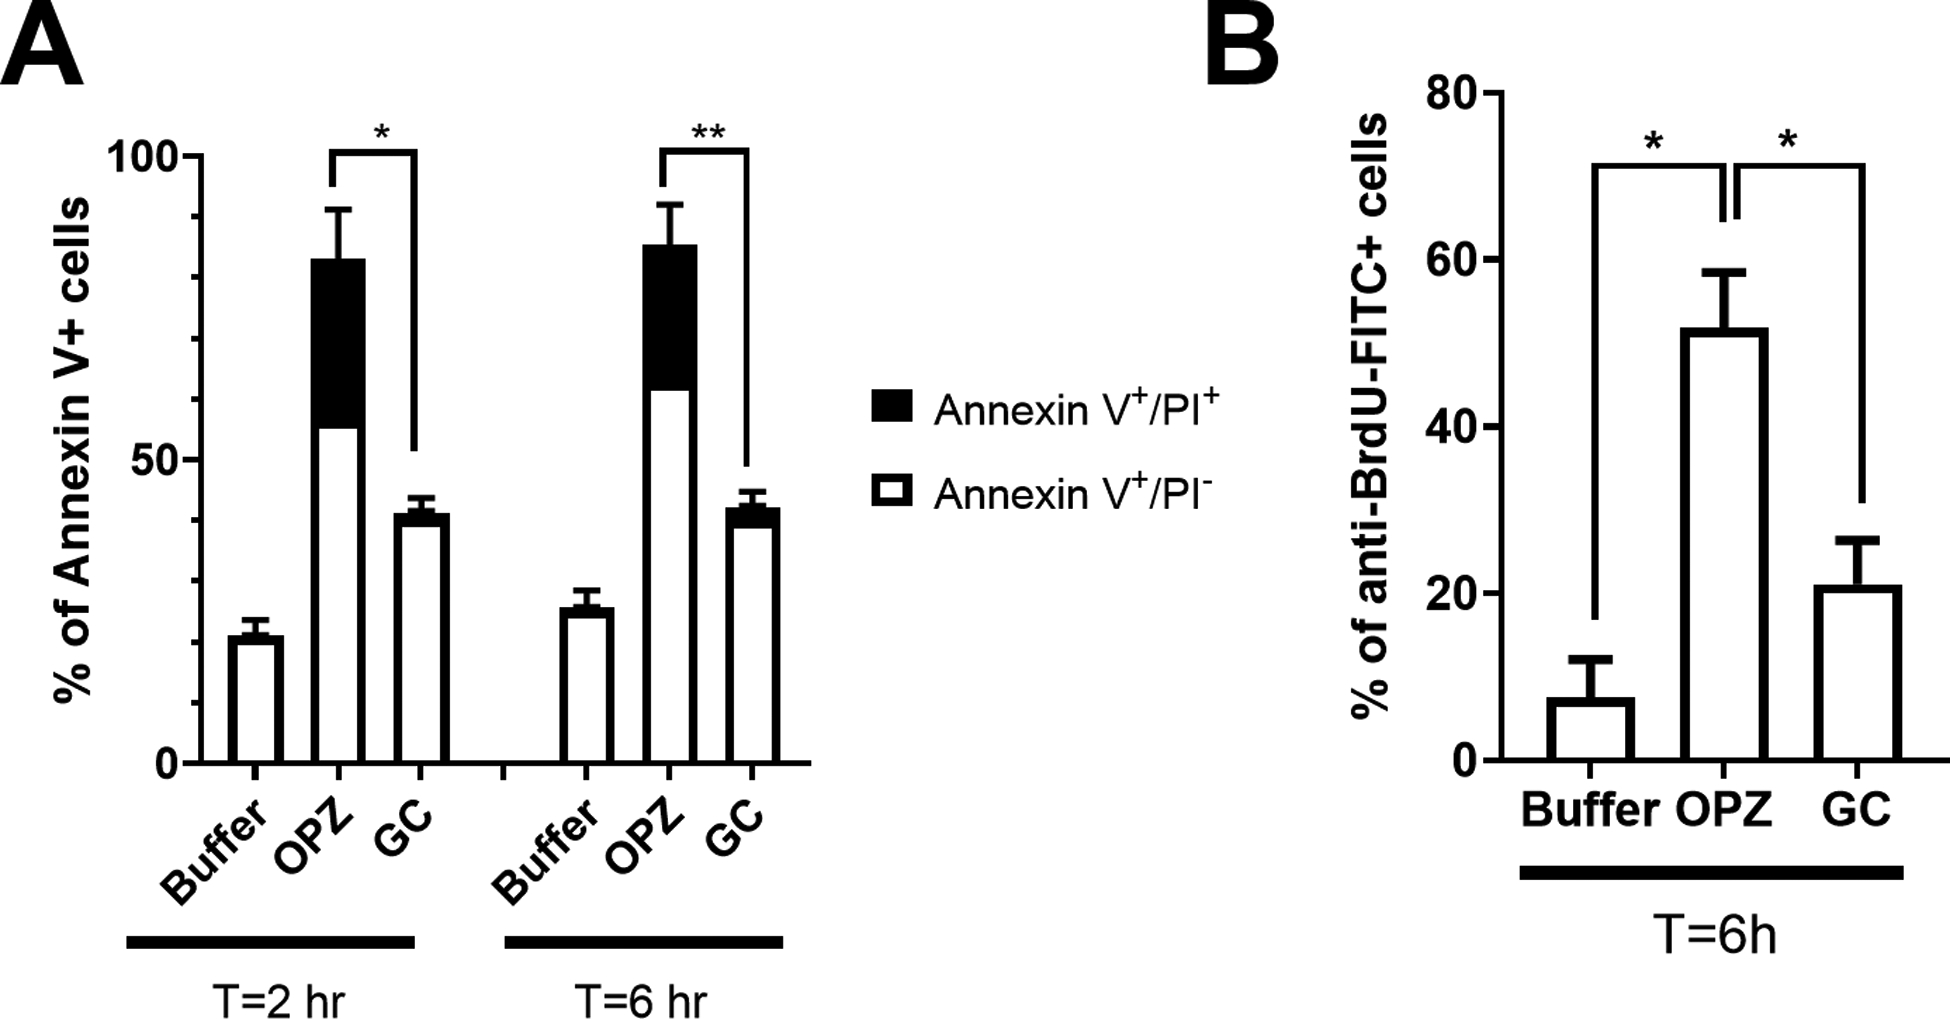
Figure 1. Delayed PICD of hPMN in suspension by GC.

(A) PS exposure and plasma membrane integrity loss, markers of PICD, were quantitated with Annexin V-FITC and PI-PE staining, respectively. The increase in the percent of apoptotic hPMN (Annexin V+/PI−) after phagocytosis of GC (10:1 MOI) was significantly less than that after ingestion of OPZ (10:1 MOI), both at 2 and 6 hours, as was the percent of Annexin V+/PI+ hPMN. (B) DNA fragmentation, another marker of PICD, was decreased in hPMN fed GC (10:1 MOI) compared to that of OPZ (10:1 MOI) at 6 hours. Bars represent the average ± SEM from at least three independent experiments. p-values were determined using a two-way ANOVA and Turkey’s posttest (** p < 0.005; * p < 0.05).
