
Fig. 3. Interkinetic nuclear migration and mitosis of cortical apical progenitors are impaired in HD mouse embryos.
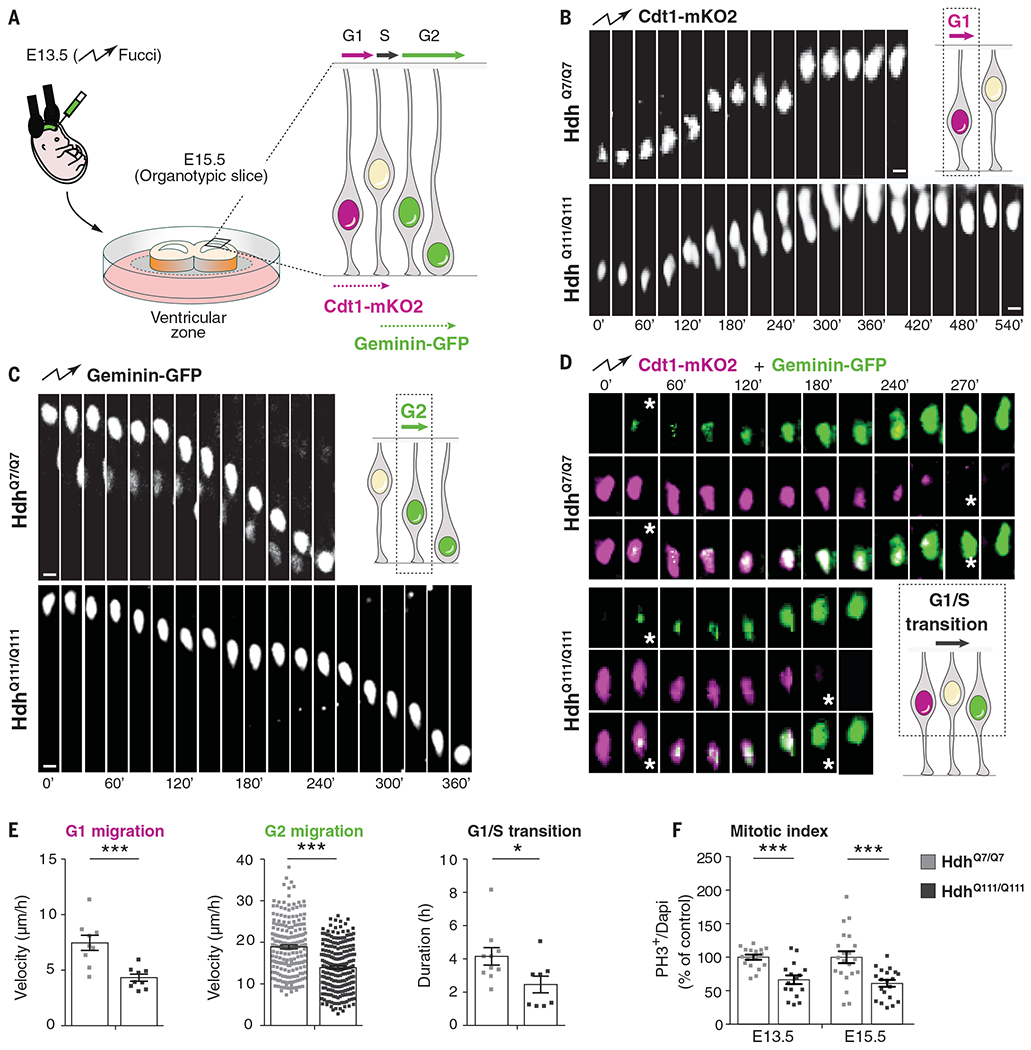
(A) Schematic of the experiment for analysis of interkinetic nuclear migration. E13.5 HdhQ7/Q7 and HdhQ111/Q111 embryos were electroporated with Cdt1-mKO2 and geminin-GFP constructs. After 48 hours, the movement of the GFP- and mKO2-labeled nuclei was followed by spinning disc microscopy, taking one image every 10 or 15 min for 10 hours. (B to D) Representative images showing the movement of nuclei in G1, G2, and G1/S transition phases as indicated. (D) Stars indicate the beginning and ending of the G1/S transition. Scale bars, 5 μm. (E) Quantitative differences in the velocity of G1-phase nuclei [for each condition, n = 9 cells from three embryos from different mothers; ***P = 0.0008 (unpaired t test)], velocity of G2-phase nuclei [for each condition, n = at least 202 cells from four embryos from different mothers; ***P < 0.0001 (Mann-Whitney U test)], and length of G1/S transition [for each condition, n = at least 8 cells from three embryos from different mothers; *P = 0.0356 (unpaired t test)]. (F) Bar graphs show the percentage of phospho-histone 3 (PH3) cells (mitotic index) of dividing progenitors [E13.5: for each condition, n = at least 2151 cells from four embryos from different mothers, ***P < 0.0001 (unpaired t test); E15.5: for each condition, n = at least 1801 cells from three embryos from different mothers, ***P = 0.0005 (unpaired t test)]. Results are means ± SEM.