Figure 1.
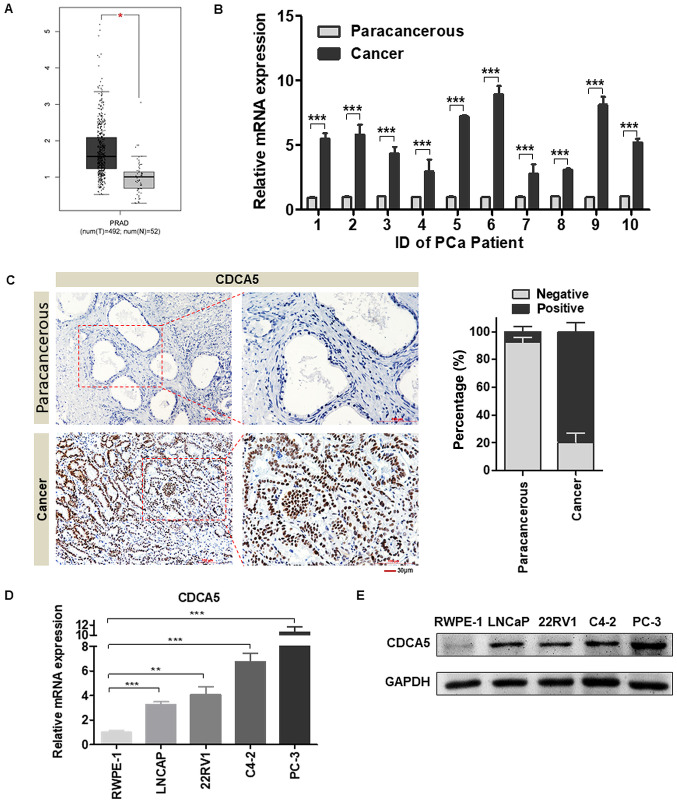
CDCA5 expression is higher in PCa tissues than in adjacent tissues. (A) GEPIA was used to assess the differences in CDCA5 mRNA levels in PCa tissues and normal prostate tissues in TCGA database [(num(T)=492, num(N)=52, *P<0.05]. (B) RT-qPCR was used to detect the CDCA5 mRNA expression level in PCa and adjacent surgical specimens from tumour patients (n=10 pairs) (***P<0.001). (C) Representative IHC images of CDCA5 in PCa and paracancerous tissues (magnification, ×200 and ×400). The histogram revealed the statistical results of the histochemical positive rate (right panel) (n=96). (D) RT-qPCR was used to detect the mRNA expression levels of CDCA5 in RWPE-1, LNCaP, 22RV1, C4-2 and PC-3 cells. GAPDH was used as an internal control (n=3; **P<0.01 and ***P<0.001). (E) Western blotting was used to detect the protein expression levels of CDCA5 in RWPE-1, LNCaP, 22RV1, C4-2 and PC-3 cells. GAPDH was used as an internal control. CDCA5, cell division cycle-associated 5; PCa, prostate cancer; GEPIA, Gene Expression Profiling Interactive Analysis; TCGA, The Cancer Genome Atlas; RT-qPCR, reverse transcription-quantitative PCR.

