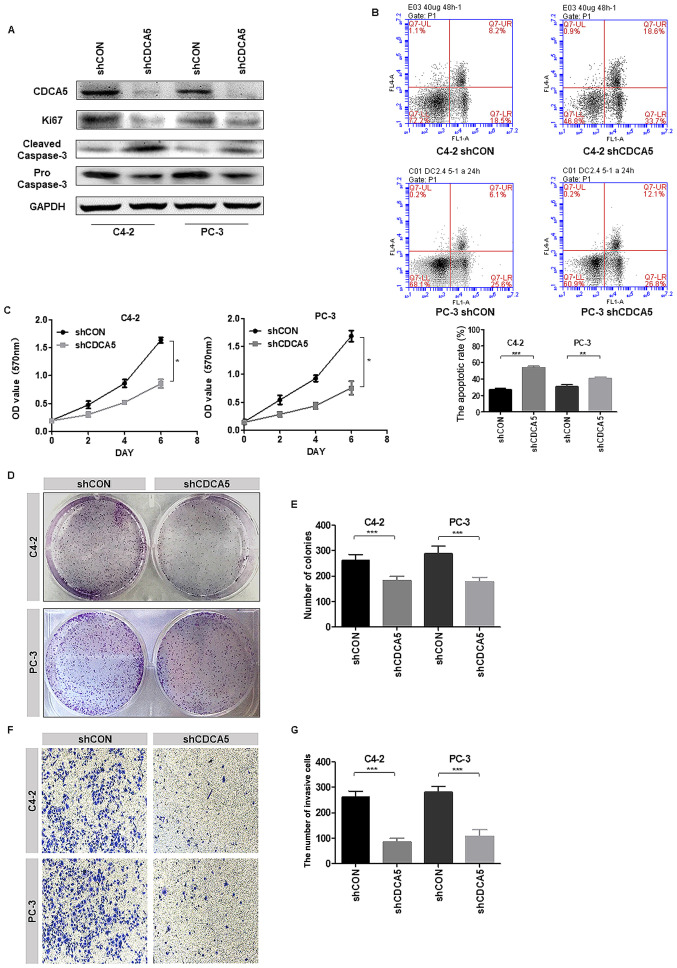
Figure 3.
Knockdown of CDCA5 inhibits PCa cell proliferation and invasion in vitro. (A) Western blotting was used to detect the expression levels of CDCA5, Ki67 and cleaved/pro caspase-3 after CDCA5 knockdown in C4-2 and PC-3 cells. GAPDH was used as an internal control. (B) Flow cytometry was used to detect apoptosis in C4-2 and PC-3 cells after CDCA5 knockdown. The apoptotic rate (early apoptosis + late apoptosis) of C4-2 and PC-3 after knockdown CDCA5 was counted and plotted on a graph (**P<0.01 and ***P<0.001). The UL region indicates cell necrosis, the LL region indicates cell survival, the LR region indicates early cell apoptosis, and the UR region indicates late cell apoptosis. The LR region + UR region indicate total apoptosis. (C) An MTT assay was used to detect C4-2 and PC-3 cell growth after CDCA5 was knocked down. The absorbance value at a wavelength of 570 nm was detected (*P<0.05). (D) A colony formation assay was used to detect C4-2 and PC-3 cell growth after CDCA5 knockdown. (E) The number of colonies from D was counted and plotted (***P<0.001). (F) Transwell invasion assays detected the invasiveness of the prostate cancer cells after knockdown of CDCA5. (G) The number of invaded cells in F was counted and plotted on a graph (***P<0.001). CDCA5, cell division cycle-associated 5; PCa, prostate cancer; sh, short hairpin; CON, control; UL, upper left; LL, lower left; LR, lower right; UR, upper right.

