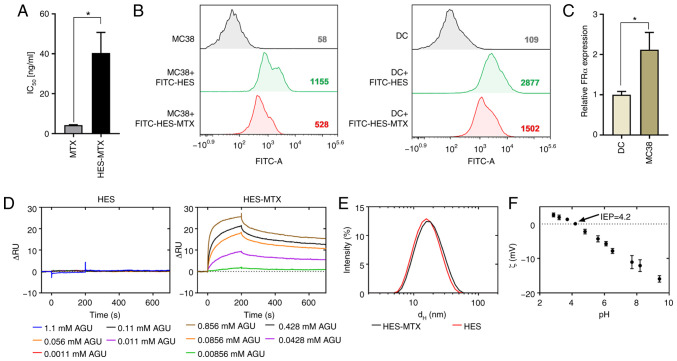
Figure 1.
(A) Antiproliferative activity of MTX and HES-MTX against MC38 cells after a 72-h treatment was measured by MTT assay and the IC50 value was calculated. (B) Representative histogram showing the interaction of FITC-conjugated HES-MTX and HES with MC38 cells and DCs after a 24-h treatment measured by flow cytometry. The numbers presented on the histograms represent mean fluorescence intensity (MFI) values. (C) Relative expression of folate receptor α (FRα) measured by real-time PCR in murine DCs and MC38 cells. (D) Representative sensorgrams from SPR measurements showing the association and dissociation phase of HES and HES-MTX conjugate from FBP immobilized on the surface of the CM5 chip. Sensorgrams are shown after subtraction for reference channel and blank measurements. Concentrations for both HES and HES-MTX are shown as anhydroglucose unit (AGU). (E) Size distributions are shown according to intensity measured by dynamic light scattering technique. dH, mean hydrodynamic diameter. (F) Zeta (ζ) potential of HES-MTX as a function of pH measured by dynamic light scattering technique. The points denote experimental values determined for ionic strength 0.15 mM; IEP, isoelectric point. Results (A and C) are expressed as the mean ± SD calculated for at least three independent experiments. Differences between the groups were estimated by (A) Mann-Whitney test (*P<0.05) and (C) unpaired t-test (*P<0.05). HES, hydroxyethyl starch; MTX, methotrexate; DC, dendritic cells.

