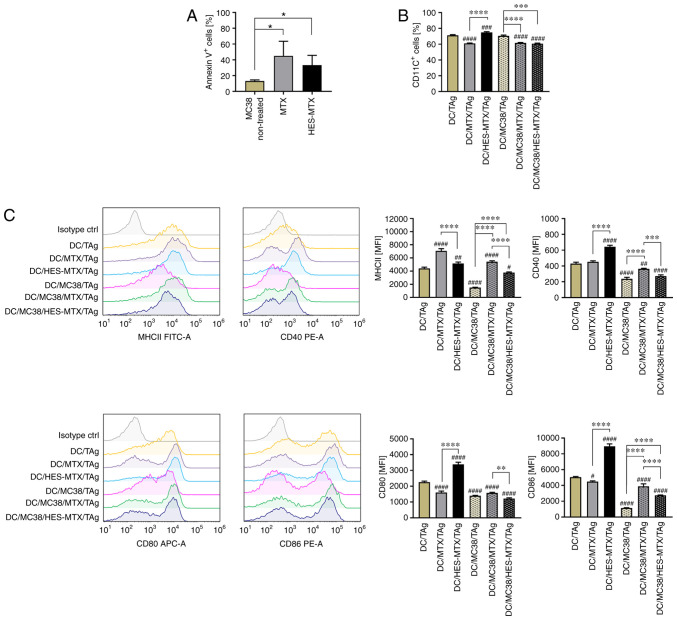
Figure 2.
Modulation phenotype of mature DCs generated in the presence of metabolites released by MC38 cells after MTX or HES-MTX treatment. (A) Percentage of Annexin V+ MC38 cells after a 72-h treatment with MTX or HES-MTX as determined by Annexin V binding assay; (B) Bar plots showing the percentage of CD11c+ mature DCs (stimulated with TAg) (C) Bar plots and representative histograms showing the expression of MHC II and costimulatory molecules on mature DCs. Results are expressed as mean ± SD calculated for three independent experiments. Differences between groups were calculated using (A) the Brown-Forsythe and Welch ANOVA test followed by Dunnett's T3 multiple comparisons post-hoc test or (B and C) one-way ANOVA followed by Tukey's multiple comparison post-hoc test. The asterisks (*) presented in the graphs indicate statistically significant differences between the given groups; a hashtag (#) above a bar indicates a statistically significant difference between the given group and the control group-DC/TAg (*/#P<0.05, **/##P<0.01, ***/###P<0.001 and ****/####P<0.0001). HES, hydroxyethyl starch; MTX, methotrexate; DCs, dendritic cells; TAg, tumor antigen.

