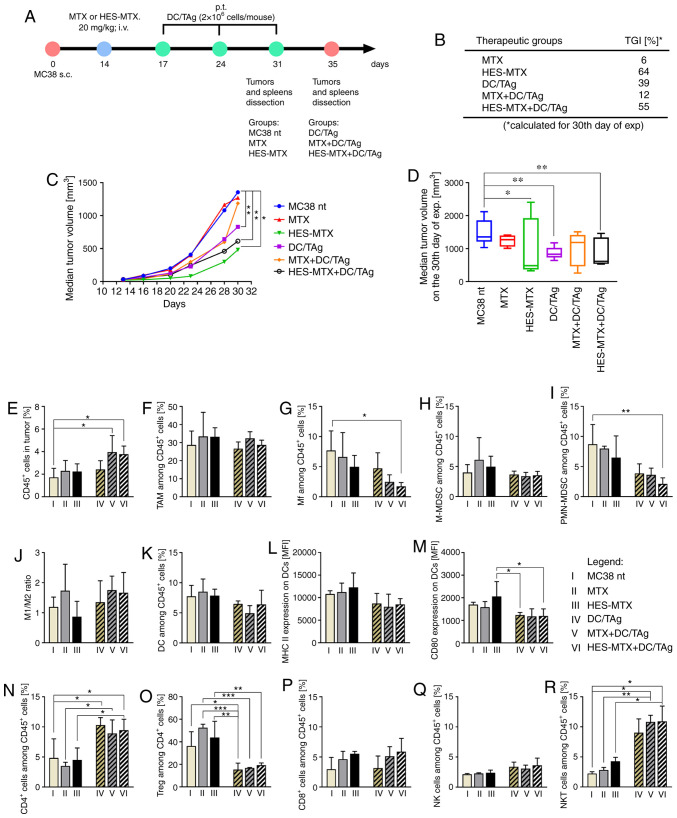
Figure 5.
Impact of combined therapy on tumor growth and infiltration of MC38 tumor nodules with immune cells. (A) Scheme of treatment. (B) Table presenting MC38 tumor growth inhibition (TGI) calculated on 30th day of experiment in relation to the MC38 nt group; (C) Graph presenting median tumor volume after chemoimmunotherapy. (D) Box graph presenting median tumor volume, calculated on the 30th day of the experiment. (E) Percentage of CD45+ cells in tumor nodules. (F-I) Percentage of myeloid cell subpopulations among CD45+ cells in tumors. (J) M1/M2 ratio showing changes in polarization of tumor-infiltrating macrophages after therapy. (K-M) Percentage of DCs infiltrating into tumor tissue and expression of MHC II and CD80 molecules on their surface. (N-R) Percentage of lymphoid cell subpopulations among CD45+ cells in tumors. Scheme of multiparameter flow cytometry analyses showing the method of distinguishing myeloid or lymphoid cell subpopulation in tumors is presented in Fig. S3A. Results are expressed as mean ± SD (3–5 mice per group were analyzed from one experiment). The differences between groups were calculated by (C and D) two-way ANOVA followed by Bonferroni's multiple comparisons test, (E-Q) one-way ANOVA followed by Tukey's multiple comparison post-hoc test or (R) Brown-Forsythe and Welch ANOVA test followed by Dunnett's T3 multiple comparisons post-hoc test (*P<0.05, **P<0.01, ***P<0.001). HES, hydroxyethyl starch; MTX, methotrexate; DCs, dendritic cells; TAg, tumor antigen; TAMs, tumor-associated macrophages; Mf, macrophages; M-MDSC, monocytic myeloid derived suppressor cells; PMN-MDSC, polymorphonuclear myeloid derived suppressor cells; Tregs, regulatory T cells; NK, natural killer; i.v., intravenously s.c., subcutaneously.

