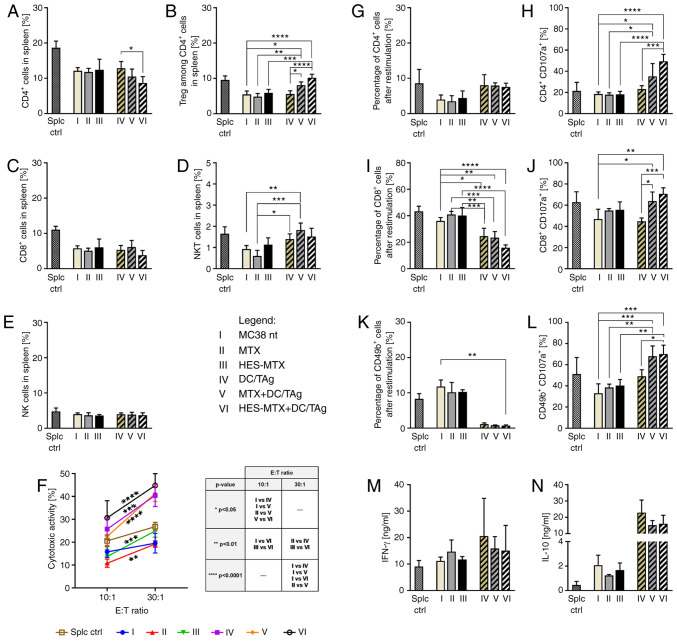
Figure 6.
Effect of applied chemoimmunotherapy on induction of systemic antitumor response. (A-E) Percentage of effector and suppressor lymphoid cell subpopulations in spleens of MC38 tumor-bearing mice treated according to the scheme presented in Fig. 5A. (F) Cytotoxic activity of splenocytes (effector cells) against DiO+ MC38 cells (target cells). Asterisks above or under the lines indicate statistical significance between different E:T ratios within a given group, while statistical significance between groups within a given E:T ratio is presented in the table. (G-L) Percentage of Th, CTL and B NK cells (CD49b+) among splenocytes after restimulation of spleen cells with MC38 cells and the percentage of CD107a+ among CD4+, and cytotoxic CD8+ and CD49b+ cells measured by CD107a degranulation assay. (M and N) IFN-γ and IL-10 concentration in supernatants after restimulation. Scheme of multiparameter flow cytometry analyses showing the method of distinguishing lymphoid cell subpopulation in spleens is presented in Fig. S3B. Results are expressed as mean ± SD (3–5 mice per group were analyzed from one experiment). Splc ctrl, splenocytes isolated from spleen derived from healthy mice (i.e. without MC38-tumor). Differences between groups were calculated using: (A-E, G-J and L) one-way ANOVA followed by Tukey's multiple comparison post-hoc test (K, M and N) the nonparametric Kruskal-Wallis test followed by Dunn's multiple comparison test; or (F) two-way ANOVA followed by Tukey's multiple comparison post-hoc test (*P<0.05, **P<0.01, ***P<0.001, ****P<0.0001). HES, hydroxyethyl starch; MTX, methotrexate; DCs, dendritic cells; TAg, tumor antigen; Tregs, regulatory T cells; Th, T helper; CTL, cytotoxic T lymphocyte; NK, natural killer; IFN, interferon; IL, interleukin.

