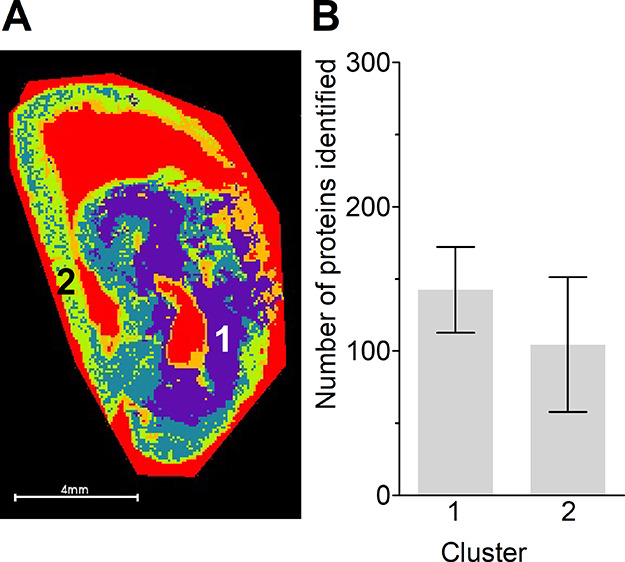
Figure 7.

Segmentation data from positive ion-mode lipid analysis (A). The numbers indicate clusters 1 (purple) and 2 (green), and an area of 0.5 mm2 was ablated. (B) The number of proteins identified from clusters 1 and 2 Data are represented as mean ± SD.
