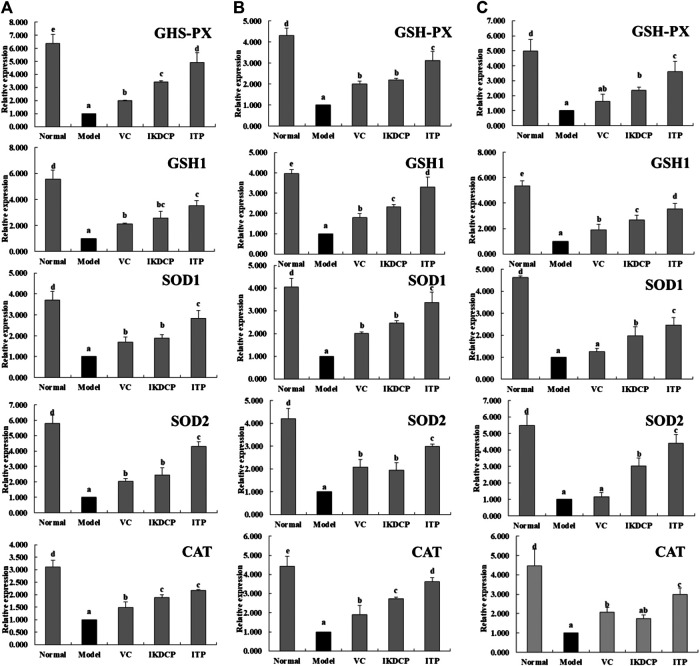
FIGURE 4.
The GSH-PX, GSH1, SOD1, SOD2 and CAT mRNA expression in liver (A) skin (B) spleen (C) tissue of mice. a–eMean values with different letters in the bar are significantly different (p < 0.05) according to Duncan’s multiple-range test. VC: mice treated with vitamin C (100 mg/kg); IKDCP: mice treated with polyphenol of Ilex kudingcha (500 mg/kg); ITP: mice treated with polyphenol of insect tea (500 mg/kg).

