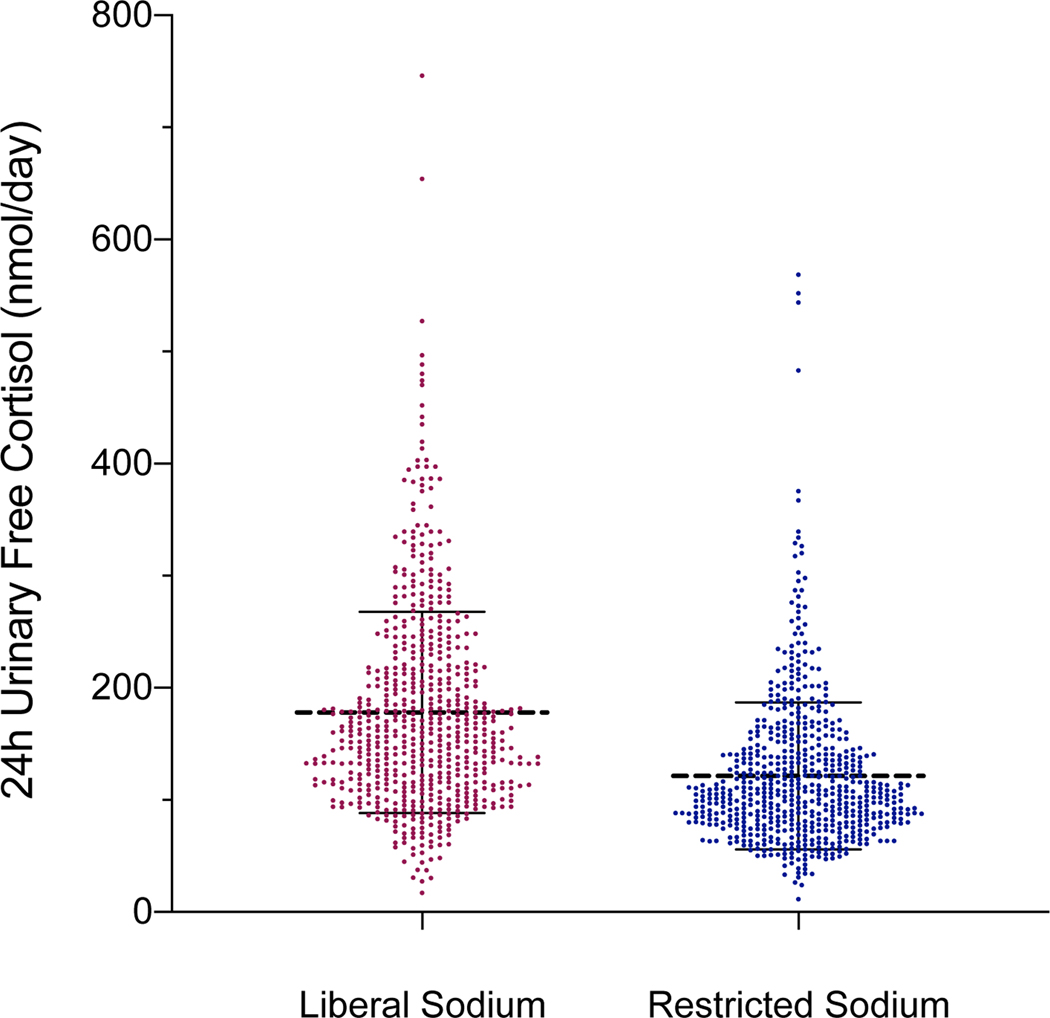
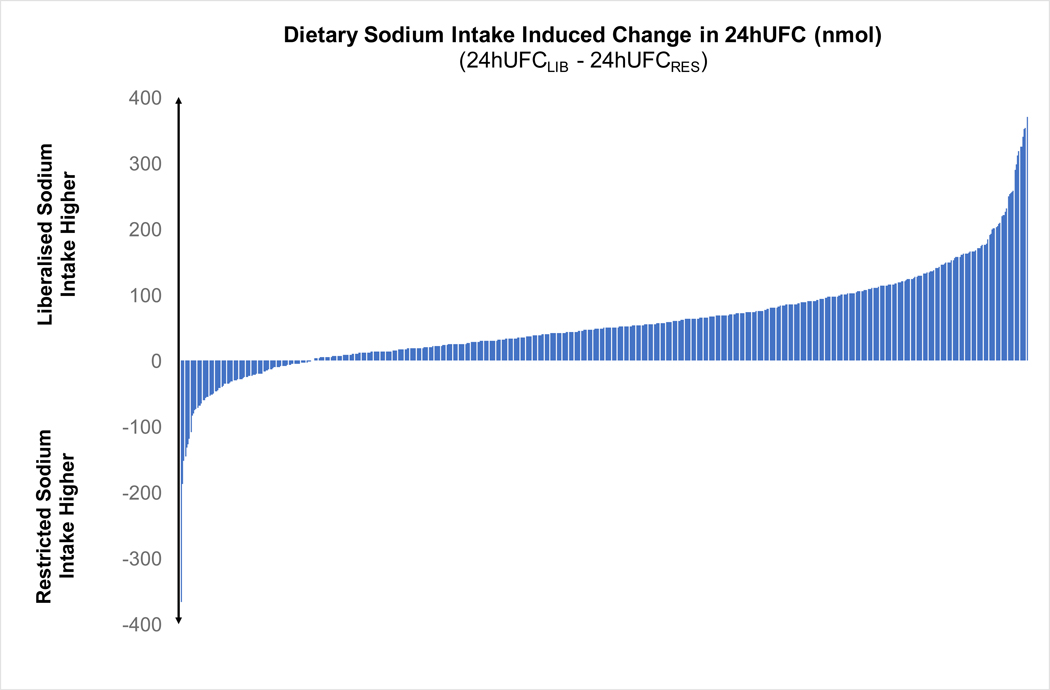
Figure 1:
A) Scatter plots of 24-hour urinary free cortisol during restricted vs. liberal sodium diet (dashed line represents the mean and hash marks represent the standard deviation); B) Waterfall plots of the change in 24-hour urinary free cortisol induced by dietary sodium intervention for each participant (24h UFCLIB – 24hUFCRES).


