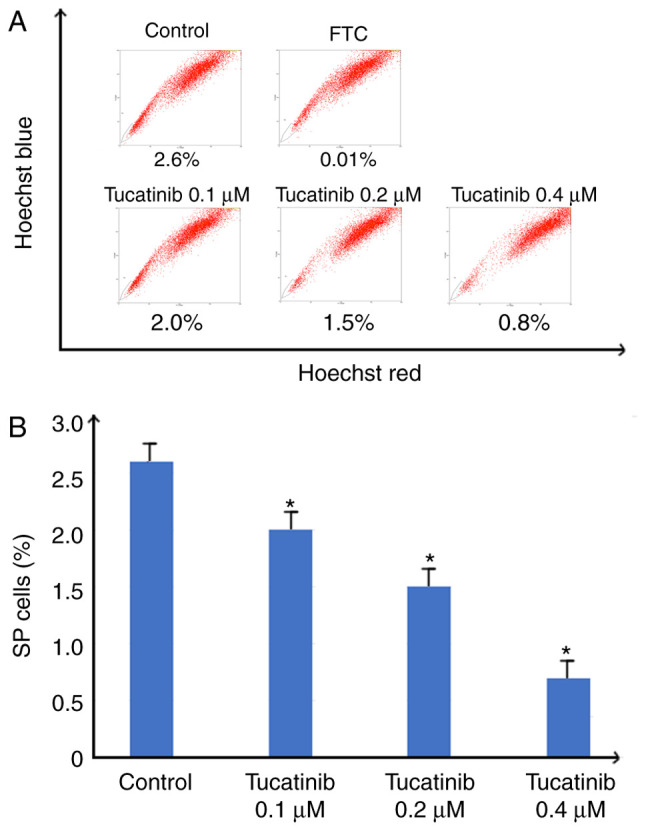
Figure 3.

Efficiency of tucatinib on decreasing the proportion of SP cells. (A) HL60 was treated with 0.1, 0.2 and 0.4 µM tucatinib for 48 h, then stained with Hoechst 33342 followed by the SP analysis. Representative flow cytometry plots are shown. (B) The results were subsequently quantified. The data are presented as the mean ± SD from 3 independent experiments. *P<0.05 vs. control. SP, side population; FTC, fumitremorgin C.
