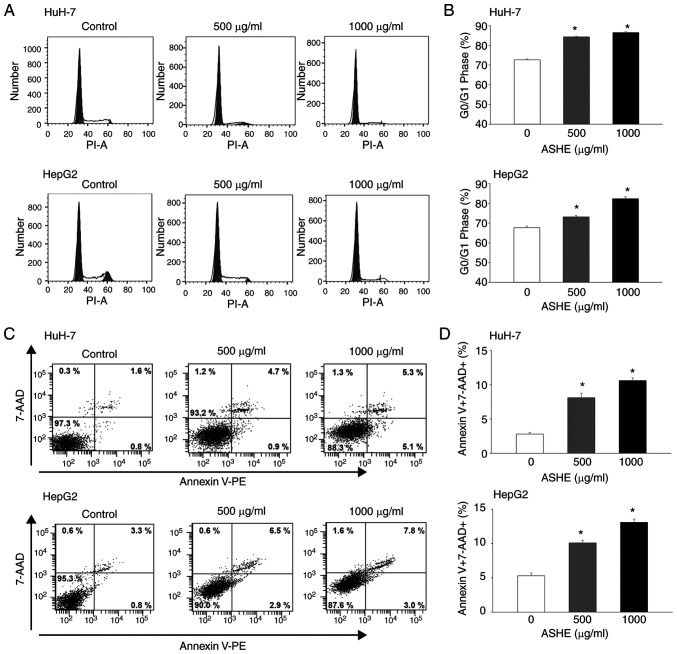
Figure 2.
ASHE causes G0/G1 cell cycle arrest and induces apoptosis. (A) Representative flow cytometry histograms of cell cycle distribution. HuH-7 and HepG2 cells were treated with ASHE in the absence of FBS for 72 h and stained with PI. The gray area between 20 and 40 units of PI-A indicates the G0/G1 phase. (B) Percentage of HuH-7 and HepG2 cells in the G0/G1 phase with or without ASHE treatment (500 and 1,000 µg/ml. (C) Representative dot plot of cells stained with Annexin V-PE and 7-AAD. HuH-7 and HepG2 cells were treated with ASHE in the absence of FBS for 72 h, followed by the assessment of apoptosis using flow cytometry. Values indicate the cell percentage in each quartile of the plots. (D) Percentage of either Annexin V-positive or 7-AAD-positive cells in HuH-7 and HepG2 cells. Data are presented as the mean ± standard deviation of three independent experiments. *P<0.05 vs. untreated cells ASHE, Acanthopanax senticosus Harms root extract; 7-AAD, 7-actino; PE, phycoerythrin; PI, propidium iodide.

