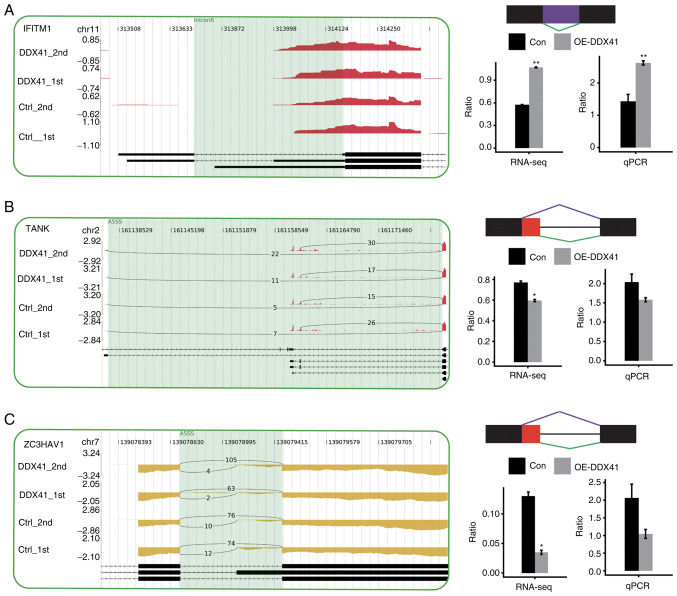
Figure 7.
Validation of DDX41-regulated ASEs in the innate immune response. Integrative Genomics Viewer-sashimi plots showing alternative splicing changes that occurred in the control or DDX41 overexpression groups of HeLa cells. The results for IFITM1 (A), TANK (B) and ZC3HAV1 (C) are shown. Transcript isoforms and the density map of the distribution all RNA-seq reads around the gene regions involved in the ASEs from the four samples are shown. Alternative splicing isoforms of each ASE are depicted with the number of reads supporting each isoform shown. Schematic diagram depicts the structure of model splicing variant AS1 (purple) and alternative splicing variant AS2 (green). Boxes indicate exon sequences; horizontal line indicates intron sequences. RNA-seq quantification of alternative splicing regulation is shown. The changed ratio of AS events in RNA-seq was calculated using the formula: AS1 junction reads/AS1 junction reads + AS2 junction reads. The altered ratio of AS events in RT-PCR was calculated using the formula: AS1 transcripts level/AS2 transcripts level. Transcripts for genes are shown. *P<0.05 and **P<0.01. Con, control; OE-DDX41, overexpression DEAD-box helicase 41; RNA-seq, RNA-sequencing; qPCR, quantitative PCR; IntronR, intron retention; A5SS, alternative 5′ splice site.

