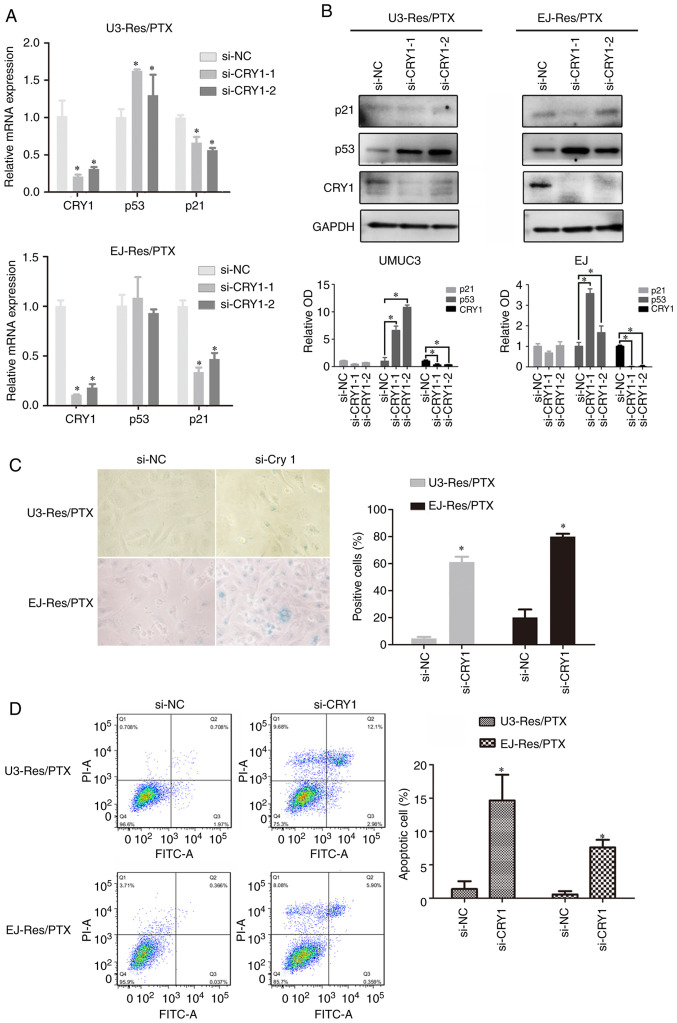
Figure 4.
CRY1 knockdown increases PTX-induced senescence. Res cells with prolonged PTX treatment were used as a cell model. Cells were transfected with CRY1 siRNA or si-NC for 48 h. (A) mRNA expression levels of CRY1, p53 and p21 were examined using reverse transcription-quantitative PCR. Data are presented as the mean ± SD of three independent experiments. *P<0.05. (B) Protein expression levels of CRY1, p53 and p21 were examined via western blotting. Data are presented as the OD fold difference related to GAPDH. *P<0.05. (C) Representative images of senescence-associated β-galactosidase staining of cells with or without Cry1 knockdown (magnification, ×400). Data are presented as the mean ± SD of three independent experiments. *P<0.05. (D) Cell apoptosis was detected using fluorescence-activated cell sorting flow cytometry. Data are presented as the mean ± SD of three independent experiments. *P<0.05. si-NC, negative control siRNA; Res, cisplatin-resistant cells; PTX, paclitaxel; OD, optical density; CRY1, Cryptochrome 1; siRNA, small interfering RNA.

