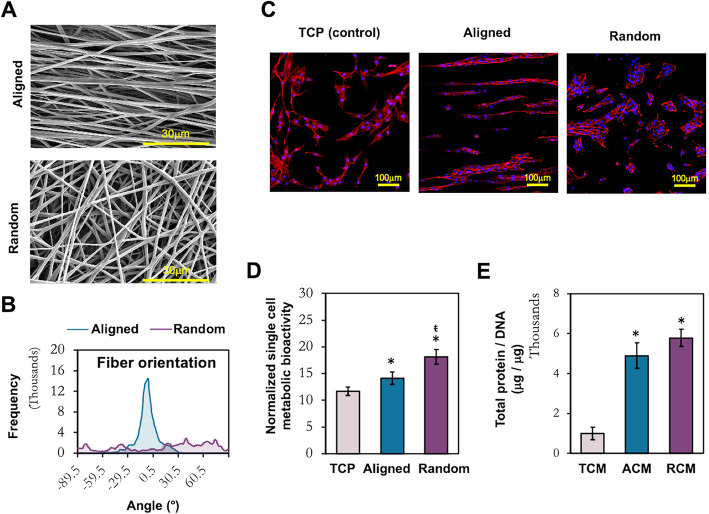
Fig. 2.
Characterization of electrospun fiber sheets and the adherent MSCs. a SEM images of the electrospun fiber sheets. Scale bar = 30 μm. b Analysis of fiber orientation. c Morphological evaluation of MSCs cultured on TCP, aligned and random fibers. Scale bar = 100 μm (× 200 magnification). d Metabolic activity of MSCs at the collection time point of CM. e Quantification of secreted protein in the CMs, normalized to the total cellular DNA of the conditioned MSCs. All data represent the mean ± SD, n = 6, from 3 independent experiments. * denotes p < 0.05 compared to TCP; ŧ denotes p < 0.05 compared to aligned fibers

