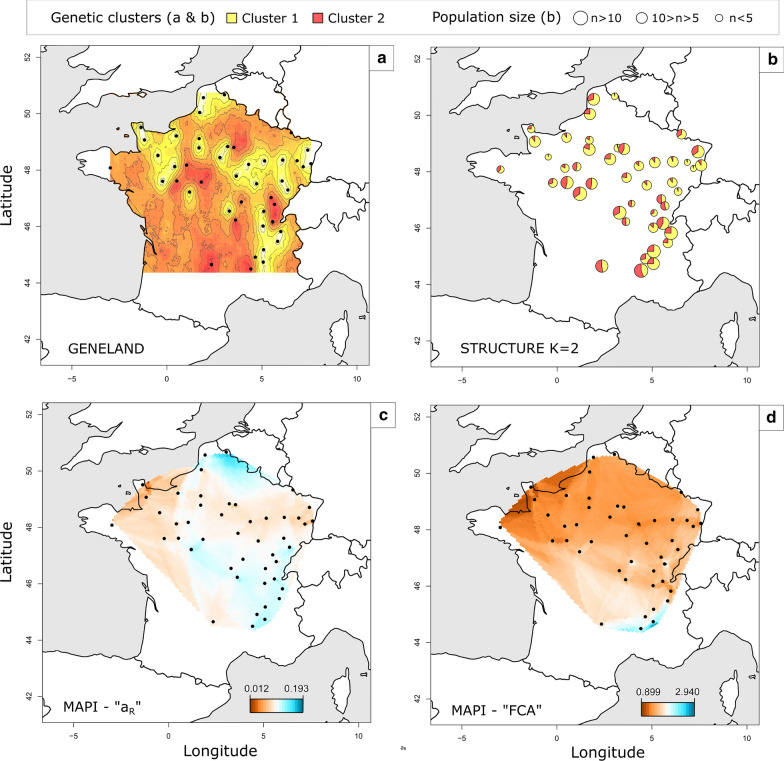
Fig. 1a–d.
Genetic clustering and genetic differentiation of Culicoides obsoletus. Results of the genetic clustering analyses performed with GENELAND (a) and STRUCTURE (b), as well as smoothing of pairwise measures performed with mapping averaged pairwise information (MAPI) and based on (c) Rousset’s (aR) and (d) factorial correspondence analysis (FCA) inter-individual genetic distances. A specific color has been assigned to each genetic cluster in a and b. c, d Genetic dissimilarity is represented by a color scale ranging from red (lower genetic dissimilarity) to blue (higher genetic dissimilarity). The black circles indicate the sampling sites

