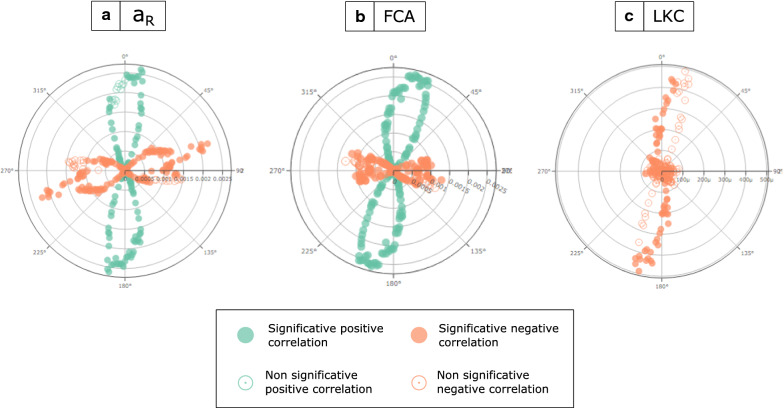
Fig. 2a–c.
Results of anisotropic isolation by distance analyses. Polar plots show the correlation between geographical projected distances by angle and inter-individual genetic distances [aR (a), Loiselle’s kinship coefficient (LKC) (b), and FCA (c)]. The set of angles between 0 and 360 were then tested as angles that maximize isolation by distance. The projected distance matrix was calculated for each angle between all sampling sites, using the formula in the Methods. A linear regression of the genetic distances on the projected geographical distances obtained for each angle was then performed. The angle that maximizes the R2 of this regression with a positive regression coefficient was considered as the angle maximizing the isolation by distance signal

