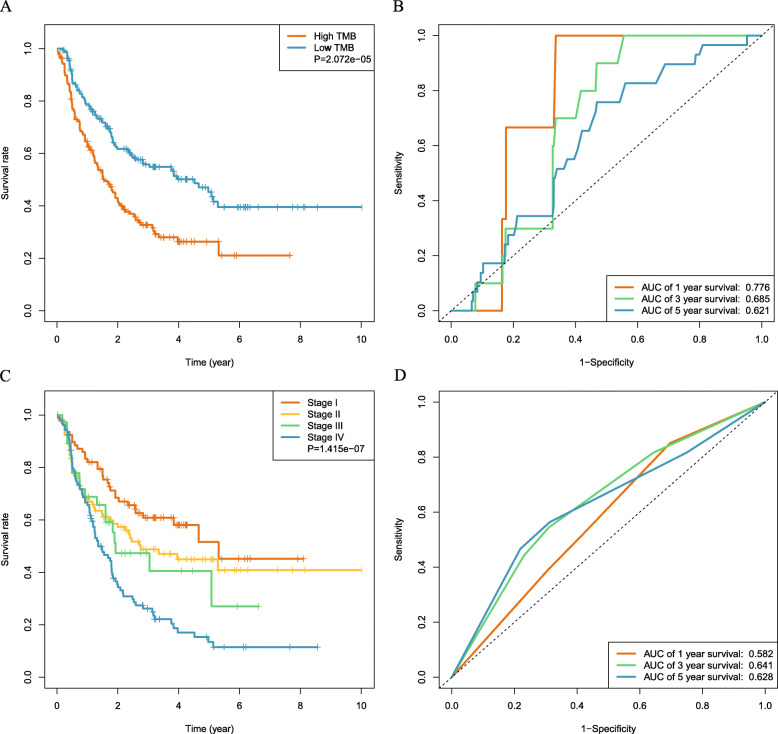
Fig. 4.
Prognostic ability of TMB in predicting the OS of iCCA patients. a Kaplan–Meier plot, used to analyze the difference in survival of the high- and low-TMB group, shows that the high-TMB group had poor survival outcomes. b Time-dependent ROC curve analysis shows that the AUCs for TMB were 0.776, 0.685, and 0.621 for 1, 3, and 5-year OS, respectively; this analysis demonstrates the satisfactory predictive accuracy of the TMB model. c Kaplan–Meier plot shows significant differences between patients grouped with respect to their TNM stage. d Time-dependent ROC curve analysis of the TNM stage

