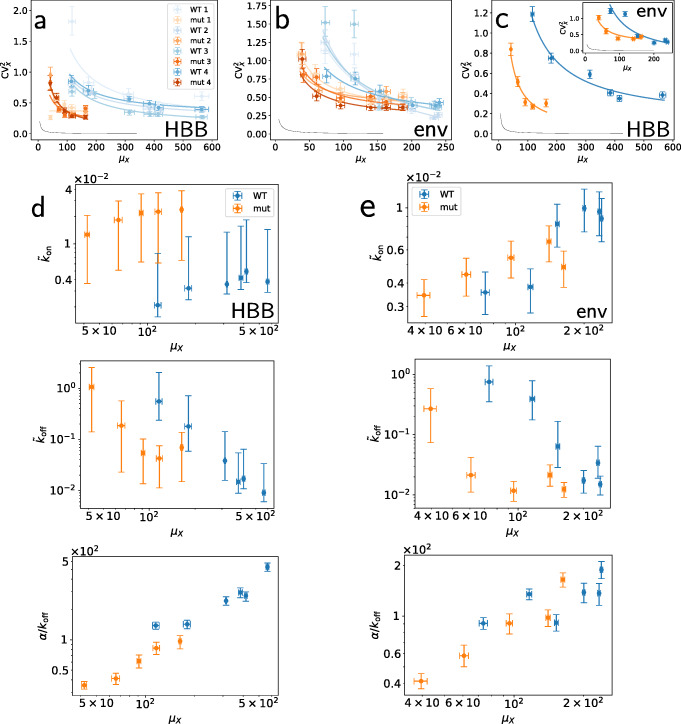
Fig. 3.
Bayesian parameter estimates. Noise plots of HBB (a) and HIV (b) gene expressions, obtained from the Poisson-beta model for both WT (blue) and mutant (orange) gene variants. Different colour intensities correspond to replicates. Mutation changes the balance between noise and average expression level. c Results from replicates are aggregated into consensus estimates (Additional file 1: Section S4) for HBB and HIV (inset). Solid lines are orthogonal-distance regression curves . d, e Consensus estimates of Poisson-beta model parameters , and α/koff for HBB (d) and HIV (e). WT (blue) and mutant (orange) show different patterns, with WT genes having highest average burst size and lower burst frequency than mutant at intermediate expression levels. Single-replicate estimates, and negative binomial and Poisson model results are in Additional file 1: Section S6. Points and error bars correspond to medians and 90% HPD CIs of the posterior distributions

