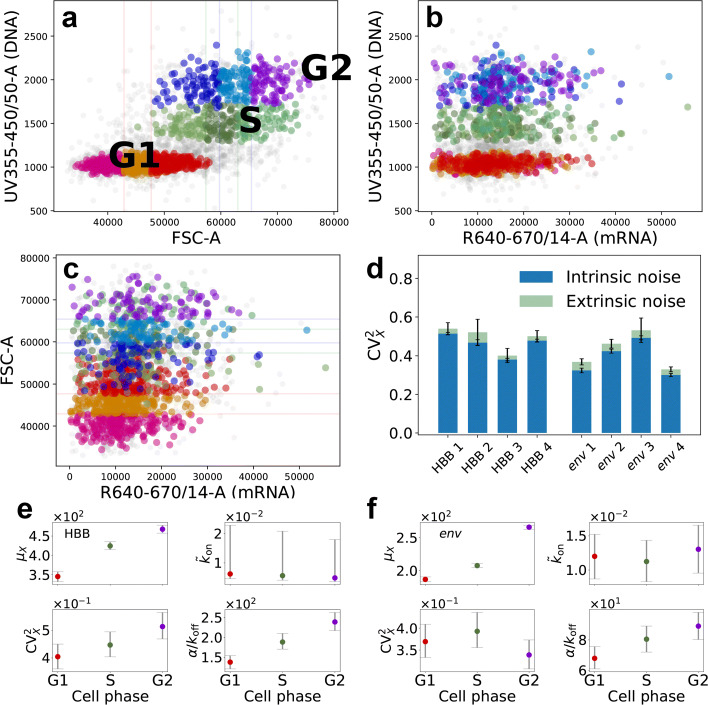
Fig. 4.
Extrinsic and intrinsic noise. a–c Scatter plots from flow-FISH signals for the HBB gene, replicate k=3; cells from G1, S, and G2 phase highlighted with red-, green-, and blue-scale colours, respectively; each cell-phase cluster is split into three subsets of different average size with breakpoints at 0.33th and 0.99th quantiles of their FSC-A signals; cell-phase and size are extrinsic variables. d Extrinsic and intrinsic contributions to WT HBB and env genes’ expression noise, SE error bars obtained via bootstrap. e, f Cell cycle analysis; consensus estimates of the negative-binomial model parameters for the same genes; points are medians, error bars comprise 90% HPD CIs

