Fig. 5.
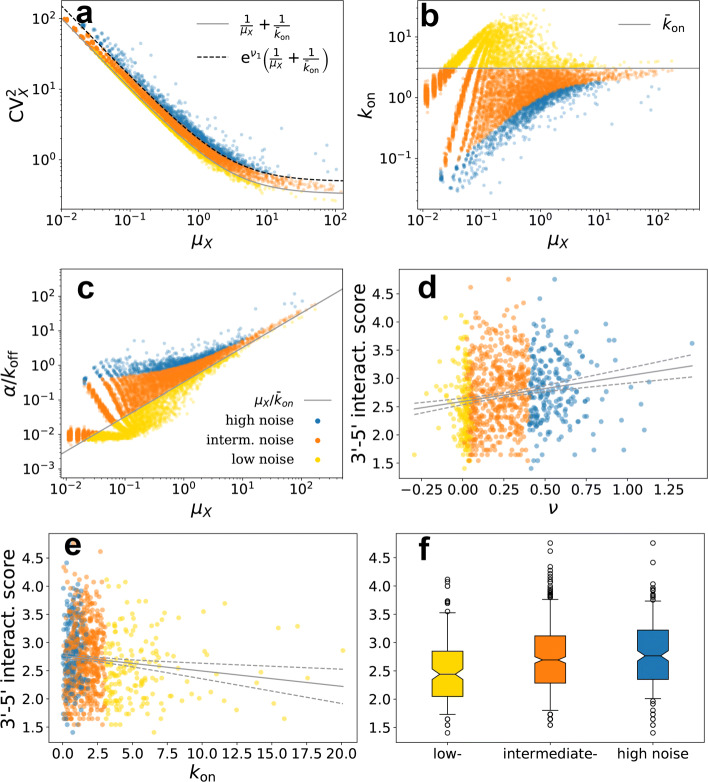
Genome-wide estimates of transcription kinetics and 3 ′- 5′ interactions. a–c Scatter points correspond to genes, axes are medians of posterior distributions for expression parameters μX and , and α/koff, respectively, obtained by Bayesian model fitting. Solid lines correspond to the predictions obtained by assuming that all genes have burst frequency equal to the sample average . Genes are divided into three groups corresponding to low-, intermediate-, and high-noise levels (yellow, orange, and blue markers, respectively). Dashed line is obtained by setting ν1=4.5 (equation inset in a) to separate intermediate- and high-noise genes. d, e 3 ′- 5′ interaction scores against expression noise (measured as distance ν from the solid-line prediction of a) and burst frequency kon. f Partitioning the genes by ν shows that the interaction score is significantly higher in higher-noise genes than in lower-noise genes (Mann-Whitney U test, P <2.2·10−16)

