Fig. 6.
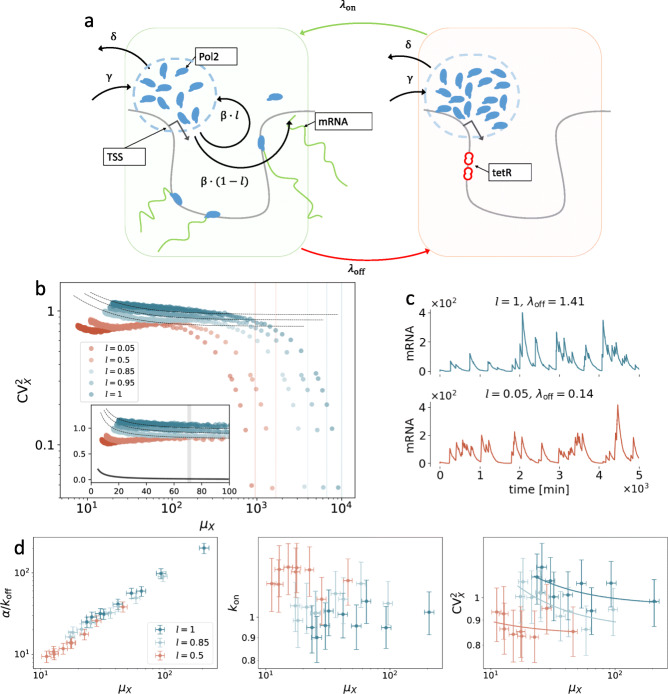
Microscopic model of transcription in Tet-inducible genes. a PolIIs (blue) are stored in a compartment (dashed circle) in the proximity of the TSS. With rate β, each PolII leaves the compartment to transcribe mRNA and is re-injected with probability l. When TetR (tetracycline repressor) binds to the TetO 2 operator downstream of the TSS (this occurs at rate λoff), transcription is interrupted and PolIIs accumulate in the compartment. At rate λon, TetR unbinds, thus releasing the large amount of PolIIs accumulated in the compartment to cause bursts, which can be phenomenologically described in terms of the rates , and . The compartment also exchanges PolIIs with the nuclear environment (at rates δ and γ). The transcription rate is directly proportional to the abundance of PolIIs, which fluctuates in time and in turn elicits transcriptional noise. Similarly to our experimental system, here, we can simulate different Tet concentrations and the recycling probability by tuning the “off”-switch rate λoff and l, respectively. b Noise plots of simulated mRNA abundances. Setting λoff=nKλ and λon=Kλ, we imitate the effect of different TetR concentration values by tuning n. As Tet presence prevents TetR-TetO 2 binding, small values of n correspond to high Tet-induction levels. For extremely small values of n, the gene can be thought of as being always in “on” state, CV2 becomes very low, and the limiting value of μX can be analytically obtained (vertical lines, see also SI Appendix, section S8). n ranges from 0.1 to 100, and values of the other parameters are (γ,β,d,δ,Kλ)=(10,10,0.01,1,0.01). Inset: same scatter plot, axes in linear scale. At intermediate expression levels, always increases with l. Dashed lines are orthogonal-distance regression curves , and solid line is Poisson-noise curve . c Simulated mRNA-population traces; the two parameter combinations yield almost identical average expressions (sample means 71.3±0.7 and 70.4±0.6 over 104 realisations, respectively, SEs obtained via bootstrap), but different biological noise (sample CV2s 0.78±0.01 and 1.07±0.02, respectively). d Negative-binomial model fit to 500 mRNA abundances simulated from the microscopic model with λoff=0.5,1,1.5,2,2.5,3,2.5,3.5,4,4.5, values of other parameters as in b

