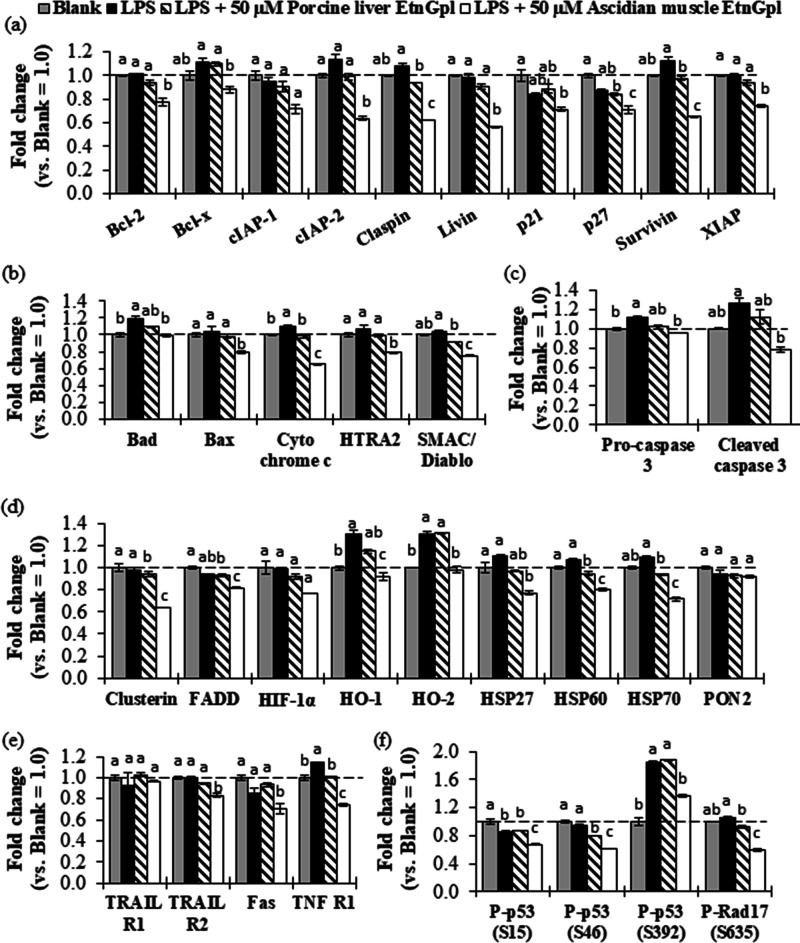
Figure 3.
Relative levels of apoptosis-related proteins (fold change vs blank) during LPS induced inflammatory stress in differentiated Caco-2 cells. (a) Antiapoptotic proteins. (b) Proapoptotic proteins. (c) Cysteine proteases. (d) Other apoptosis-related proteins. (e) Death receptors. (f) Antibody proteins. The dashed line indicates the blank group = 1.0. Different letters indicate significant differences at P < 0.05, determined by ANOVA (Tukey’s test). For abbreviations, refer to Section 4.5.

