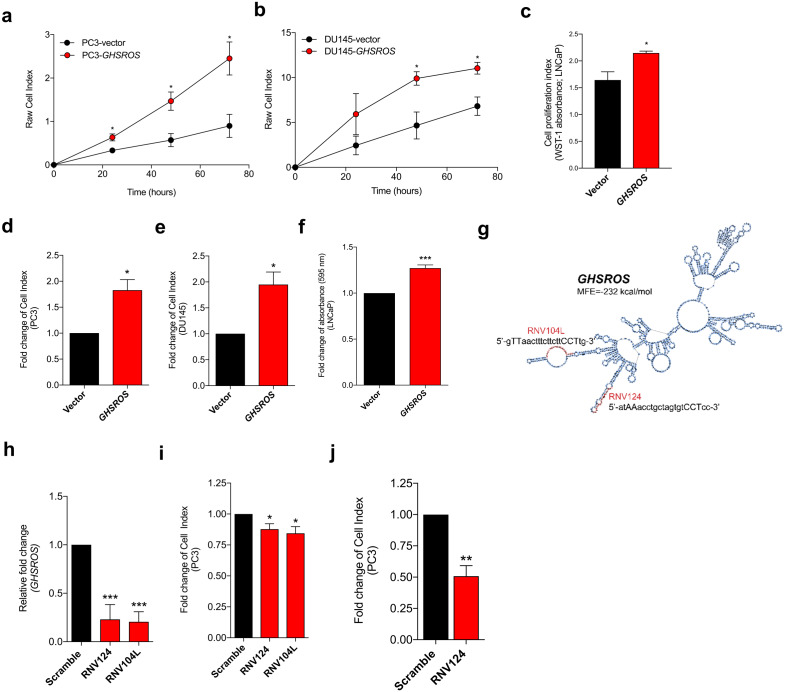
Figure 2. GHSROS promotes human prostate cancer cell line growth and motility in vitro.
(A, B, C) Increased proliferation in GHSROS-overexpressing cells. PC3 and DU145 cells were assessed using an xCELLigence real-time cell analyzer for 72 h; LNCaP using a WST-1 assay at 72 h. Vector denotes empty control plasmid. Mean ± s.e.m. (n = 3). *P ≤ 0.05, **P ≤ 0.01, ***P ≤ 0.001, Student’s t-test. (D, E, F) Increased migration in GHSROS-overexpressing cells. PC3 and DU145 cells were assessed using an xCELLigence real-time cell analyzer for 24 h; LNCaP using a transwell assay (at 24 h; n = 3). Parameters and annotations as in (A). (G) Prediction of GHSROS RNA secondary structure. The location of locked nucleic antisense oligonucleotides (LNA ASOs) that target the lncRNA are shown in red. MFE denotes minimum free energy. (H) LNA ASOs reduced GHSROS expression in PC3 cells (measured 48 h post-transfection). Fold-enrichment of GHSROS normalized to RPL32 and compared to scrambled control (n = 3). Parameters and annotations as in (A). (i) GHSROS knockdown reduces PC3 proliferation (n = 3). Parameters and annotations as in (A). GHSROS knockdown reduces PC3 migration. (J) RNV124 reduced cell migration at 18 h (n = 3). Parameters and annotations as in (C).

