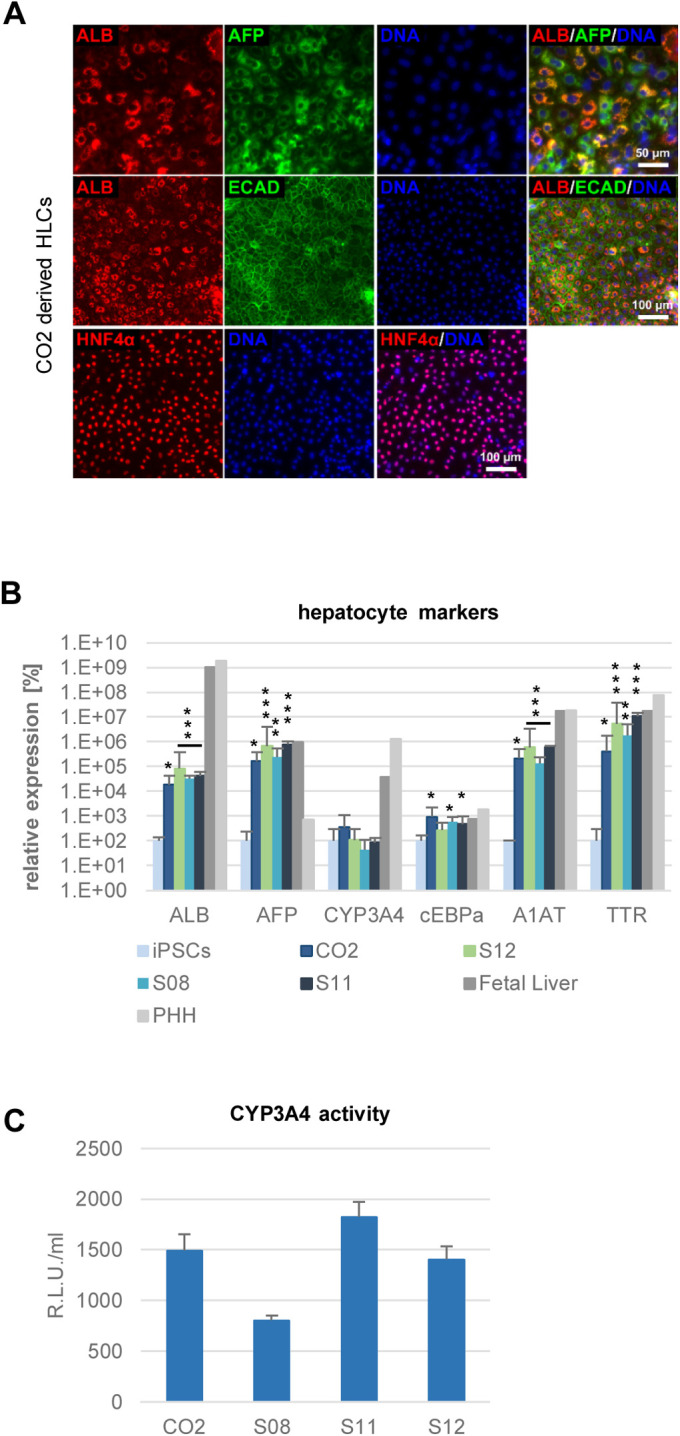
Fig. 1.

Characterization of HLCs. (A) Representative immunocytochemistry of hepatocyte markers at the end of HLC differentiation for the line CO2. Cells were stained for ALB (red) and AFP (green) (upper lane), ALB (red) and ECAD (green) middle lane, HNF4α (red) (lower lane). DNA was stained with Hoechst 33258. (B) Expression of hepatocyte markers ALB, AFP, CYP3A4, cEBPα, A1AT, and TTR was confirmed by qRT-PCR. Fold change towards iPSCs was calculated and converted into percentage. iPSCs: n=2, HLCs: n=3, PHH and fetal liver RNA: n=1. Data are means +/− 95% confidence interval. Significances in comparison to iPSCs were calculated with unpaired two-tailed Student's t-tests. *=P<0.05, **=P<0.01, ***=P<0.001. (C) CYP3A4 activity in HLCs. n=3, mean values +/− s.d. are shown.
