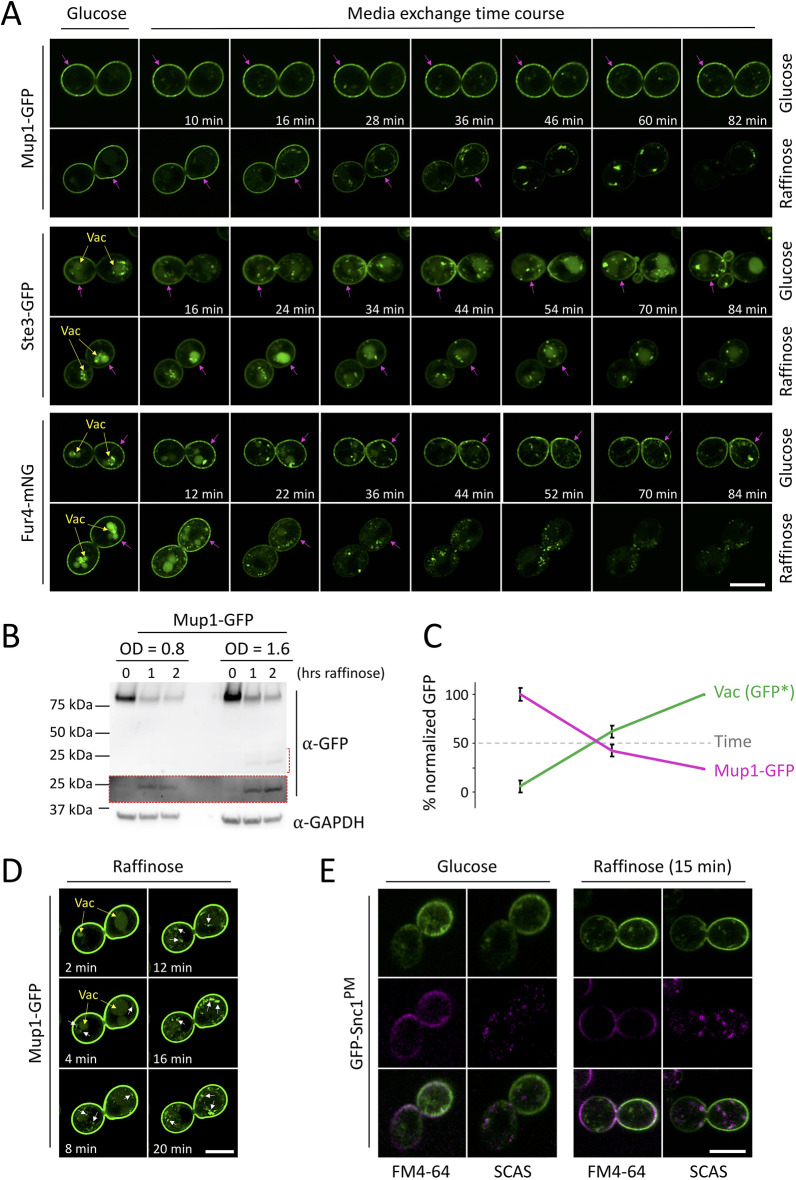
Fig. 1.
Glucose starvation results in downregulation of surface proteins. (A) Wild-type cells expressing the indicated labelled cargoes were grown to mid-log phase, processed for time-lapse microscopy and then imaged every 2 min in either glucose or raffinose media for the indicated timecourse. Vacuoles are indicated with yellow arrows, and magenta arrows denote significant plasma membrane signal. (B) Mup1–GFP levels in glucose- (0 hrs raffinose) and raffinose-treated cells first grown to the indicated densities (OD600) were assessed by immunoblotting. Increased exposure (red box) of the region indicated by a red dashed bracket shows levels of vacuolar processed GFP. Loading was assessed using anti-GAPDH antibodies. (C) Graph depicts percentage full-length Mup1–GFP versus vacuolar processed GFP [Vac (GFP*)] following raffinose addition over time, as described for B. Mean±s.d. from n=3. (D) Increased exposure of early time points from the experiment in A, to show internalised Mup1–GFP (white arrows). (E) Wild-type cells expressing GFP–Snc1PM at log phase were incubated with glucose or raffinose for 30 min prior to flushing with FM4-64-containing media for 5 min, then exchanging with media containing 2.4 µM SCAS prior to imaging. FM4-64 labelling is shown in magenta. Scale bars: 5 µm.

