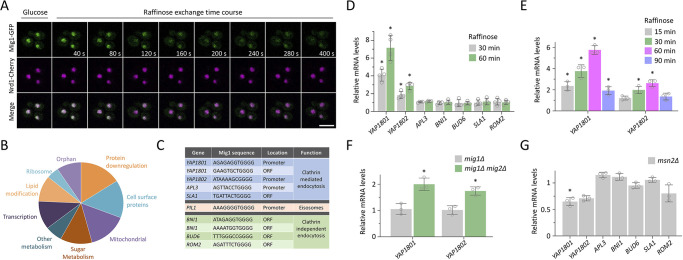
Fig. 2.
Mig1 and glucose regulate expression of clathrin adaptor genes. (A) Time-lapse microscopy of wild-type cells co-expressing Mig1–mGFP and Nrd1–mCherry grown in glucose medium prior to exchange with raffinose medium for the indicated times. (B) Pie chart showing in silico categorisation of Mig1 binding targets in the yeast genome. (C) Table of putative Mig1 target genes previously shown to function in endocytosis. (D–G) Total RNA was prepared and transcript levels measured by RT-qPCR of the indicated genes, using ACT1 and HEM2 genes as controls, from the indicated cells grown to mid-log phase in glucose medium. Comparing raffinose exchange for 30 and 60 min (D) or 15, 30, 60 and 90 min (E) with glucose controls, or comparing mig1Δ and mig1Δ mig2Δ cells (F) and msn2Δ cells (G) with wild-type cells. Jitter plots show mean±s.d. n=3–4 experiments, each with three technical replicates. *P<0.05 (unpaired Holm–Sidak t-test). Scale bar: 5 µm.

