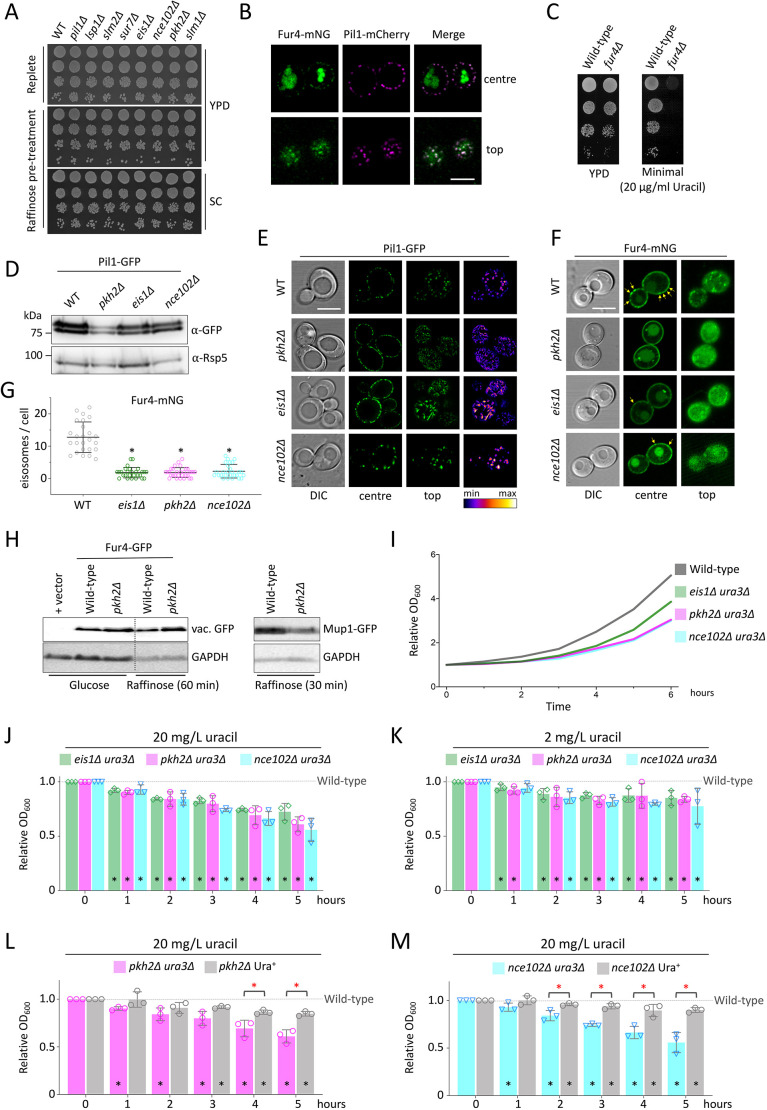
Fig. 7.
Eisosomes are required for efficient recovery following glucose starvation. (A) Mid-log cultures of the indicated yeast strains were incubated in glucose (replete) or raffinose media for 2 h, before plating on YPD or SC plates for two days at 30°C. (B) Colocalisation of Pil1–mCherry and Fur4–mNG, by Airyscan confocal microscopy focussed at the centre and top, in cells grown to mid-log phase before imaging in minimal medium. (C) Growth of wild-type and fur4Δ cells grown in rich medium prior to serial dilution and growth on YPD and SC (minimal) solid media for 2 days at 30°C. (D) Levels of Pil1–GFP expressed from a plasmid in the indicated strains were assessed by immunoblot of lysates generated from mid-log phase cells using anti-GFP antibodies, with anti-Rsp5 antibodies used as a loading control. (E) Pil1–GFP localisation of transformants from D grown to log phase was recorded by confocal microscopy at centre- and top-focussed planes. Images on the right show cells coloured using a lookup table of GFP intensity. (F) The indicated strains were transformed with a plasmid expressing Fur4–mNG from its endogenous promoter and imaged by confocal microscopy. Yellow arrows on centre-focussed images indicate pronounced eisosomal concentrations. (G) The numbers of eisosomally localised Fur4–mNG puncta per cell were quantified from the indicated yeast strains. Mean±s.d. (H) Levels of Fur4–GFP sorted to the vacuole (left) and full-length Mup1–GFP (right) were assessed from indicated strains and conditions by anti-GFP immunoblotting, using GAPDH as a loading control. (I) Indicated strains were grown to mid-log phase in SC complete medium before harvesting and growth in raffinose medium for two hours, before average recovery growth was assessed by OD600 measurements from cells incubated in SC medium. (J–M) Average recovery from assay described in I was quantified relative to the wild-type control and plotted over time for the indicated mutants at either 20 mg/l uracil (J,L,M) or 2 mg/l uracil (K). Mean±s.d. from three biological replicates. Black asterisks indicate Student's t-test comparisons with wild-type samples, red asterisks indicate comparisons between strains; *P<0.05. Scale bars: 5 µm.

