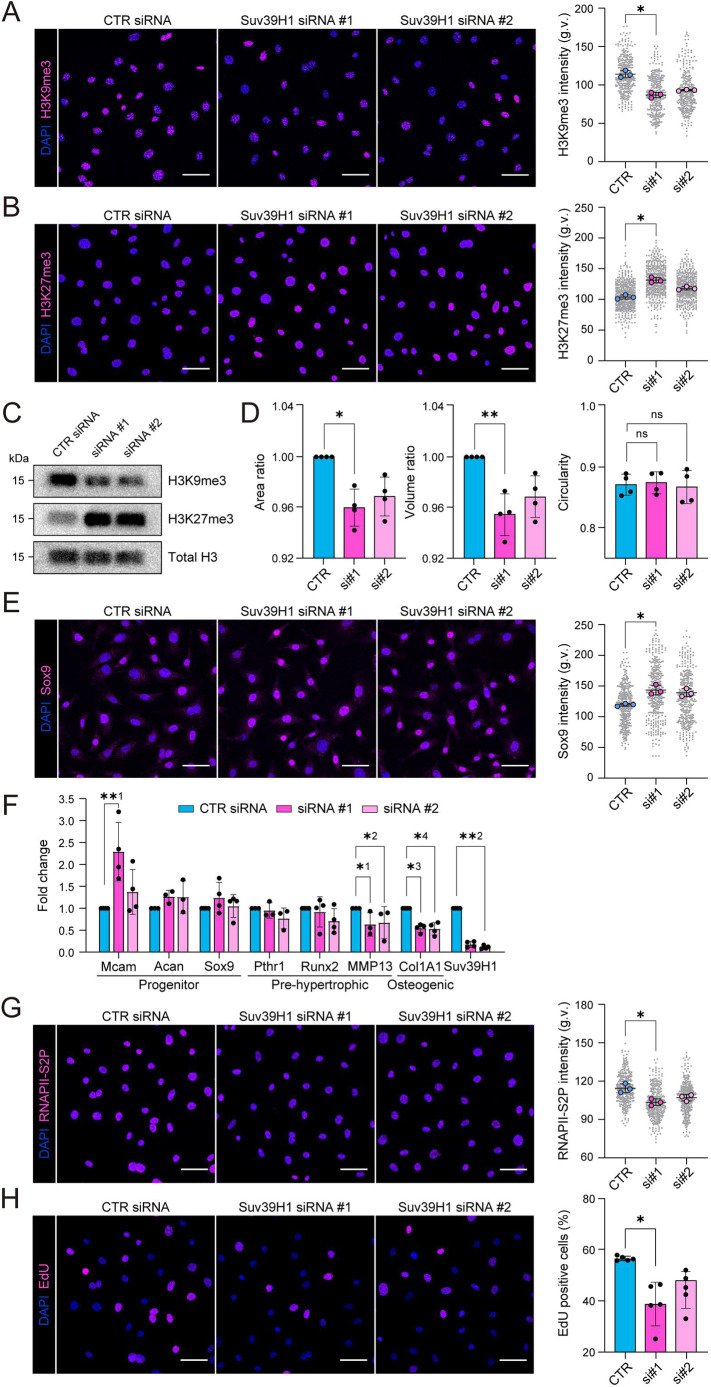
Fig. 3.
H3K9me3 heterochromatin regulates chondrocyte quiescence and identity. (A) Representative H3K9me3 (magenta) and nuclear (DAPI; blue) immunofluorescence images of cells upon siRNA knockdown of Suv39H1 (left panel). Right panel shows quantification of H3K9me3 intensity (n=3 independent experiments with >100 cells/condition/experiment). *P=0.0286 (Friedman/Dunn's test). (B) Representative H3K27me3 immunofluorescence images upon Suv39H1 knockdown and intensity quantification (n=3 independent experiments with >110 cells/condition/experiment). *P=0.0286 (Friedman/Dunn's test). (C) Representative western blots for histone modification H3K9me3 and H3K27me3 upon Suv39H1 knockdown. (D) Quantification of nuclear area, volume and circularity (n=4 independent experiments with >110 cells/condition/experiment). *P=0.0228, **P=0.0094, ns, not significant (Friedman/Dunn's test). (E) Representative Sox9 immunofluorescence images and intensity quantifications of in control and Suv39H1 knockdown cells (n=3 independent experiments with >110 cells/condition/experiment). *P=0.0286 (Friedman/Dunn's test). (F) qPCR analysis for chondrocyte progenitor markers Mcam, Acan and Sox9, and pre-hypertrophic and osteogenic differentiation markers Pthr1, Runx2, MMP13 and Col1A1 in Suv39H1 knockdown samples (n=3 or 4 independent experiments). *1P=0.0487, *2P=0.0338, *3P=0.0166, *4P=0.0166, **1P=0.0095, **2P=0.0038, (Kruskal–Wallis/Dunn's test). (G,H) Representative RNAPII-S2p and EdU immunofluorescence images and intensity quantifications of in control and Suv39H1 knockdown cells [n=3 (RNAPII-S2P) or 5 (EdU) independent experiments with >110 cells/condition/experiment]. *P=0.0286 (RNAPII-S2p); *P=0.0228 (EdU) (Friedman/Dunn's test). All bar graphs show mean±s.d. g.v., gray values. Scale bars: 50 µm.

