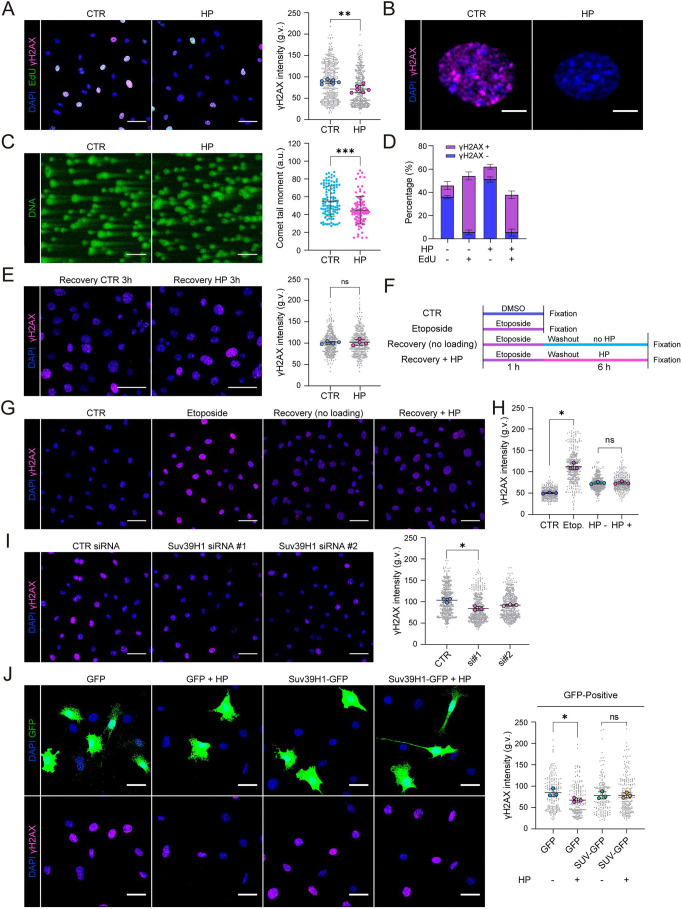
Fig. 4.
Hydrostatic pressure-controlled chondrocyte quiescence prevents replicative stress. (A) Representative EdU (green) and γH2AX (magenta) immunofluorescence images of cells exposed to control (CTR) and cyclic HP for 6 h and intensity quantification of γH2AX showing increased levels of γH2AX upon HP (n=6 independent experiments with >250 cells/condition/experiment). **P=0.0050 (paired ratio t-test). (B) Representative immunofluorescence image showing pan-nuclear staining pattern of γH2AX in CTR and attenuated signal in HP. (C) Representative images of alkaline comet assays from cells exposed to cyclic HP for 6 h and quantification of comet tails. Note decreased presence of comet tails in cells exposed to HP (n=>100 cells/condition). ***P=0.0001 (Mann–Whitney test). (D) Quantification of the relationship of EdU and γH2AX in single cells. Note that EdU-negative cells are predominantly γH2AX-negative, whereas EdU-positive cells are predominantly also γH2AX-positive both in control cells and cells exposed to HP (n=3 independent experiments with >180 cells/condition/experiment). (E) Representative γH2AX (magenta) and nuclear (DAPI; blue) images of chondrocytes exposed to cyclic HP for 6 h followed by 3 h incubation (n=4 independent experiments with >80 cells/condition/experiment). ns, not significant (Mann–Whitney test). (F) Schematics of the recovery experiment with HP loading after DNA damage induction by pulse treatment of Etoposide (10 μM, 1 h). (G) Representative γH2AX immunofluorescence images of cells obtained in the recovery experiment as described in F. (H) Quantification of immunofluorescence images in G showing increased γH2AX signals after the Etoposide pulse but no significant effect of HP loading on removal of γH2AX (n=3 independent experiments with >120 cells/condition/experiment). *P=0.0134 (Friedman/Dunn's test). (I) Representative γH2AX immunofluorescence images from cells depleted of Suv39H1 and intensity quantification (n=3 independent experiments with >110 cells/condition/experiment). *P=0.0286, (Friedman/Dunn's test). (J) Representative γH2AX immunofluorescence images and quantification from chondrocytes expressing GFP (control) and Suv39H1-IRES-EGFP exposed to cyclic HP for 6 h (n=3 independent experiments with >50 cells/condition/experiment) *P=0.0266; ns,not significant (Friedman/Dunn's test). All bar graphs show mean±s.d. a.u., arbitrary units; g.v., gray values. Scale bars: 50 μm (A,C,E,G,I); 5 μm (B); 20 μm (J).

