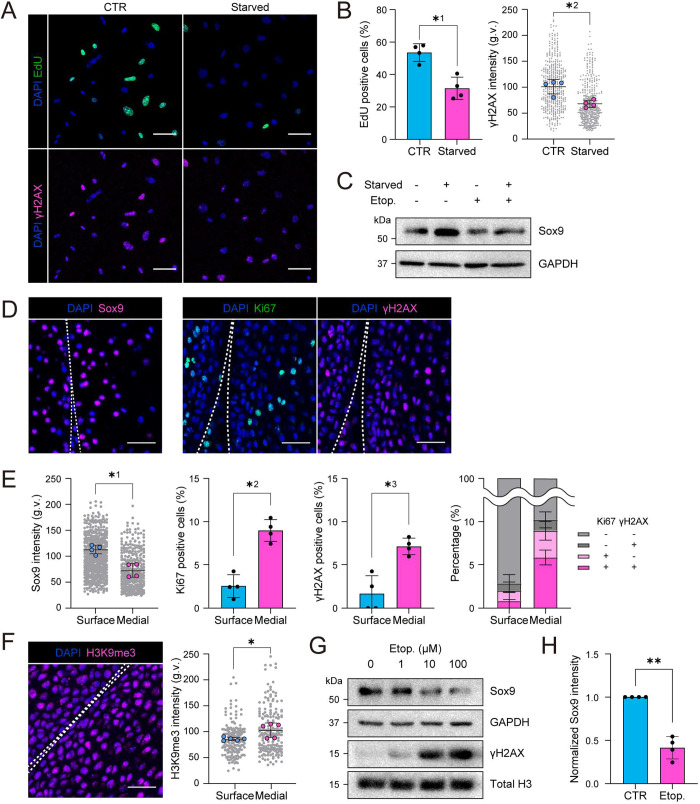
Fig. 5.
Loss of quiescence induces replicative stress to promote loss of chondrocyte identity (progenitor state). (A) Representative EdU/γH2AX chemiluminescence/immunofluorescence images of cells after 24 h serum starvation. (B) Quantification of immunofluorescence images in A showing a decrease in EdU incorporation (top) and γH2AX intensity (bottom) after starvation (n=4 independent experiments with >100 cells/condition/experiment). *1P=0.0286, *2P=0.0286, (Mann–Whitney test). (C) Representative western blots for Sox9 from cells starved for 24 h followed by Etoposide treatment (10 μM, 6 h). (D) Representative Sox9, Ki67 and γH2AX immunofluorescence images of articular cartilage in vivo from postnatal day 2 (P2) mouse cartilage. Note that Ki67-positive cells are predominantly γH2AX-positive in the medial zone. (E) Quantification for Sox9 (left), Ki67 (middle) and γH2AX intensity (right) at surface and medial zones (n=4 mice with >90 cells/zone/mouse). *1P=0.0286, *2P=0.0286, *3P=0.0286 (Mann–Whitney test). Distance ranges of 0–30 μm and 30–60 μm from cartilage surface are defined as surface and medial, respectively. Right panel shows the relationship of Ki67/γH2AX in single cells. Note that Ki67-positive cells are predominantly γH2AX-positive in the medial zone (n=3 independent experiments with >152 cells/zone/condition). (F) Representative immunofluorescence image and quantification of H3K9me3 in articular cartilage in vivo from P2 mice (n=5 mice with >90 cells/zone/mouse). *P=0.0317, (Mann–Whitney test). (G) Representative western blots for Sox9 and γH2AX for samples treated with indicated concentrations of Etoposide for 6 h. Note dose-dependent decrease in Sox9. (H) Quantification for Sox9 intensity in western blots for samples exposed to Etoposide treatment (10 μM, 6 h) (n=4 independent experiments). **P=0.0028 (one sample t-test). All bar graphs show mean±s.d. g.v., gray values. Scale bars: 50 μm (A); 30 μm (D,F).

