Fig. 3.
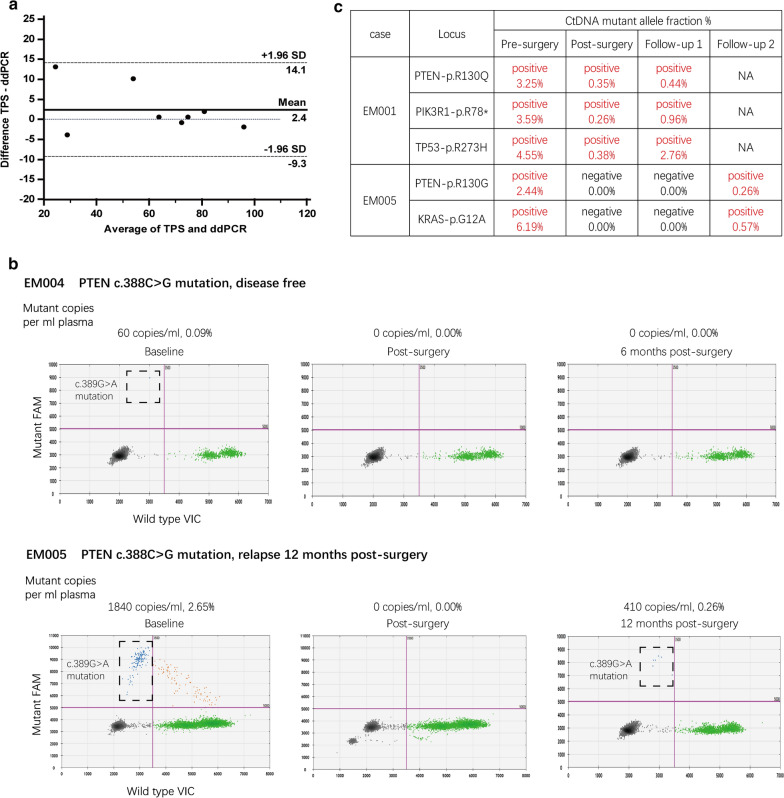
Personalized, mutation-specific ddPCR accurately quantifies ctDNA and was reproducible and reliable. a Bland–Altman plot of the agreement between mutational frequency assessed by TPS and by mutation-specific ddPCR on baseline tumor tissue DNA, with 95% CI of agreement (-9.3 and 14.1) indicated by dashed lines. Date points from eight samples are displayed and the different values of all samples are within 95% CI of agreement. b Tumors of EM004 and EM005 patients harbored the same somatic mutation (PTEN-c.389G > A). The patients had different outcomes with different ctDNA tracking results (complete time course is displayed in Fig. 4). In each ddPCR plot, green dots represent wild-type DNA (VIC-labeled), blue dots represent mutant DNA (FAM-labeled), brown dots represent droplets containing both wild-type and mutant DNA, and black dots represent droplets with no DNA incorporated. c Three/two different mutations were detected in patient EM001/EM005, and the ctDNA status remained the same among samples at each point in time

