
Figure 3.
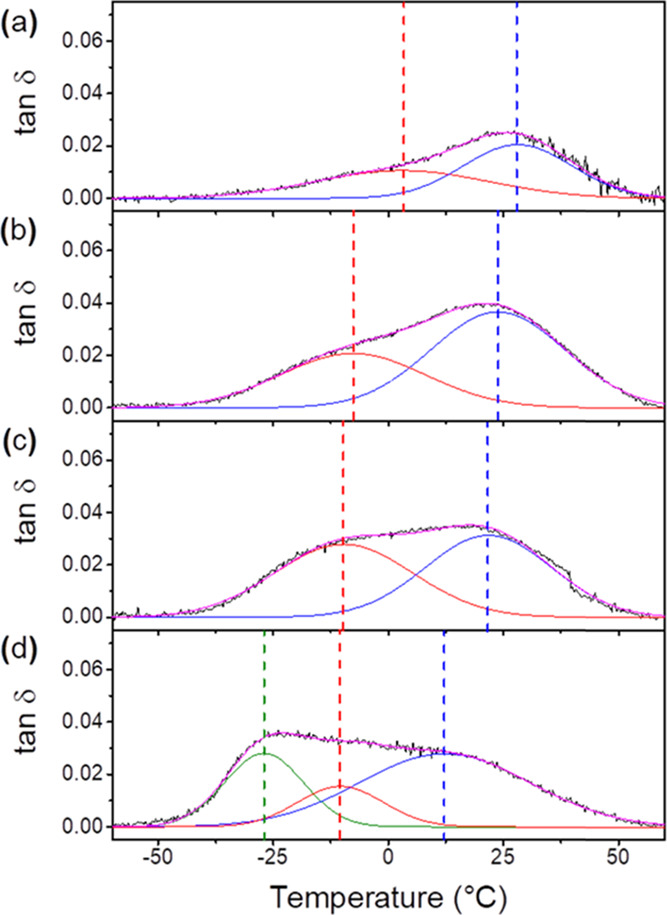
tan δ vs T curves (black line), Gaussians curves (blue and red lines) and the sum of the Gaussians (magenta line) for (a) pure PHBV and its formulations with PLAP mass fractions of (b) 0.1, (c) 0.2, and (d) 0.3.Gaussians curves for (a) pure PHBV and its formulations with PLAP mass fractions of (b) 0.1, (c) 0.2, and (d) 0.3.