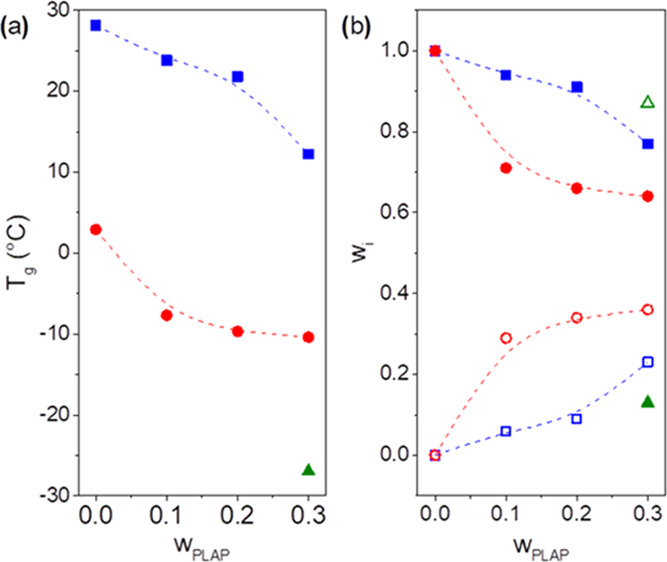
Figure 4.

(a) Glass transition temperature and (b) the PHBV (closed symbols) and PLAP (open symbols) mass fractions in the amorphous phases as a function of the PLAP mass fraction in the formulations: the rigid (box solid, box blue), mobile (circle solid, ring open red), and PLAP-rich mobile amorphous phases (triangle up solid, triangle up open green). Data determined from tan δ vs T curves.
