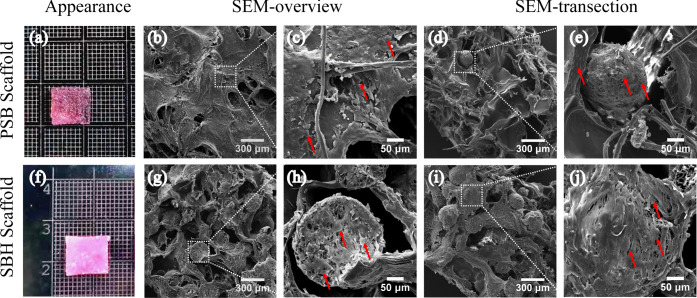
Figure 4.
Gross appearance (a, f) and SEM images (b–e,g–j) of cell-laden PSB (a–e) and SBH (f–j) scaffolds after cultivation in vitro for 4 weeks. The white squares represent the regions corresponding to the magnified SEM images. The red arrows represent the polygonal-shaped chondrocytes encapsulated in ECM, which either distribute along pore walls or aggregate as bulk in pores in the PSB group (b–e), and proliferates onto or into PLLA PMs in the SBH group (g–j).

