
Figure 6.
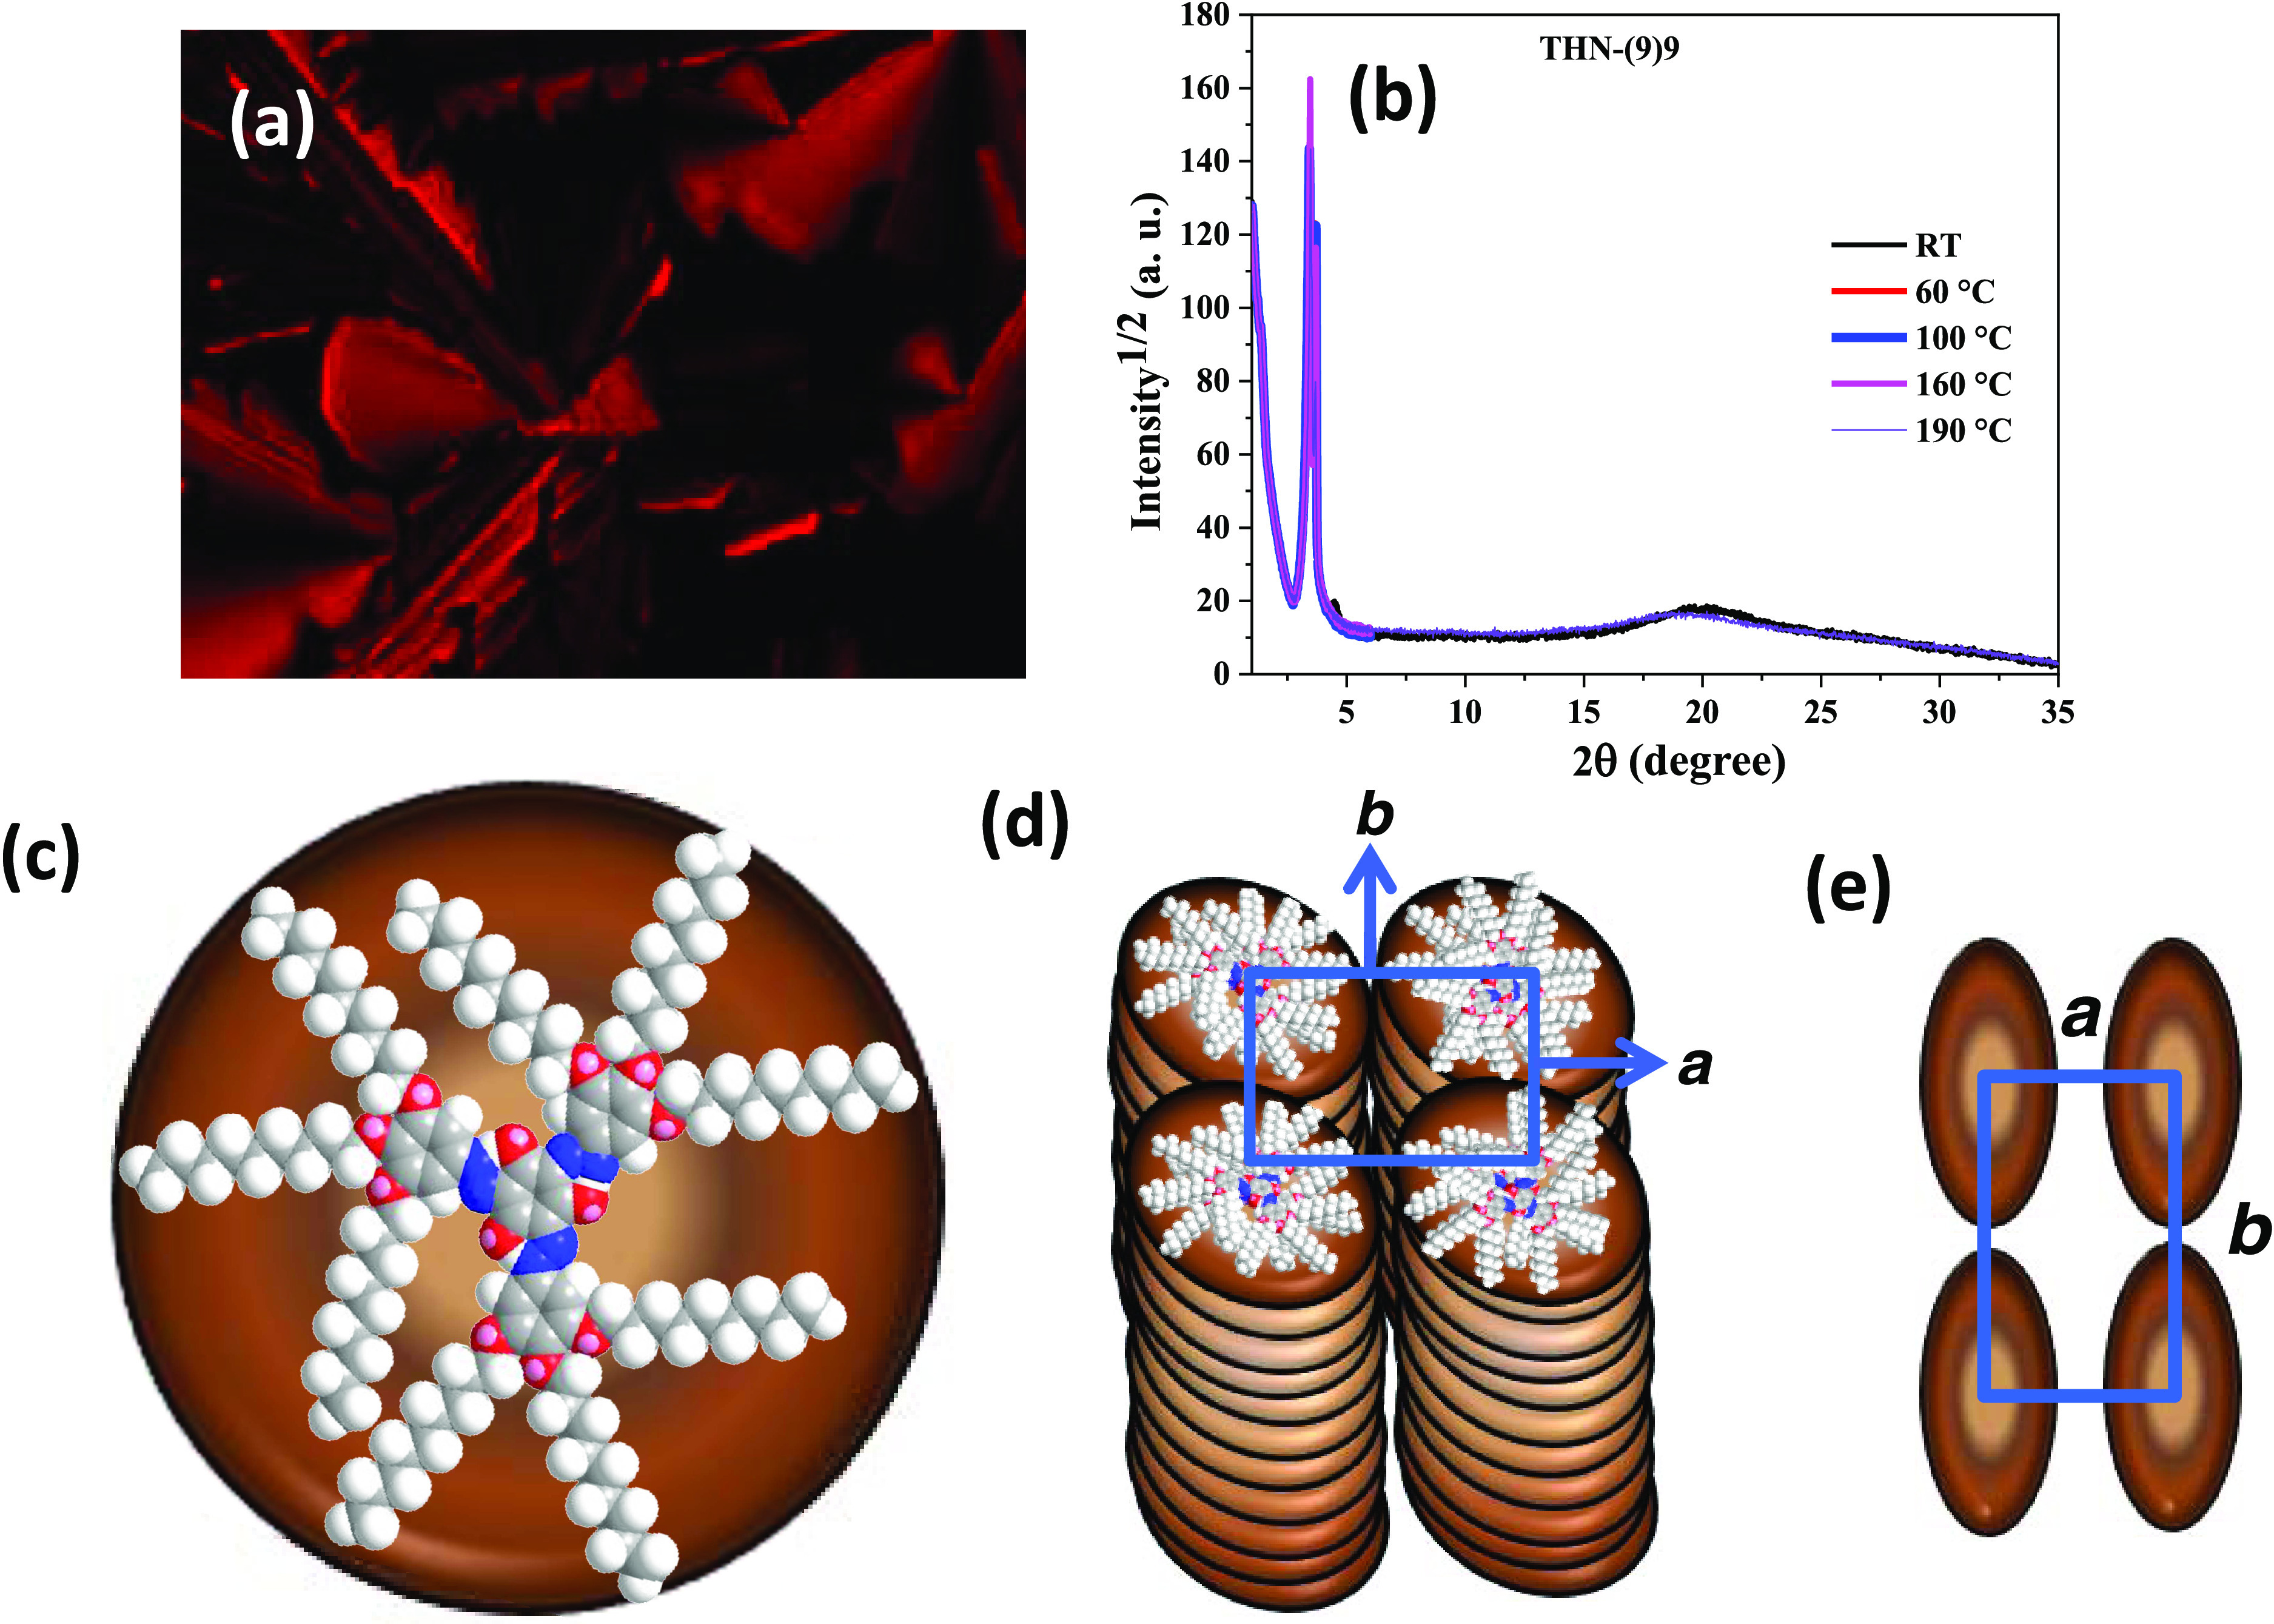
(a) Texture seen at RT for the Colr phase formed upon cooling from the sample THN(9)10B from its isotropic liquid state. (b) 1D intensity vs 2θ profiles obtained for the Colr phase of THN(9)9 at five different temperatures, including RT (28 °C). (c) Energy-minimized space-filling model of THN(9)9. (d) Schematic representation of the discogens THN(9)9 self-assembling into the Colr phase having a p2mm lattice (derived from XRD data). (e) Plan view of the 2D lattice of the Colr phase having a p2mm symmetry.