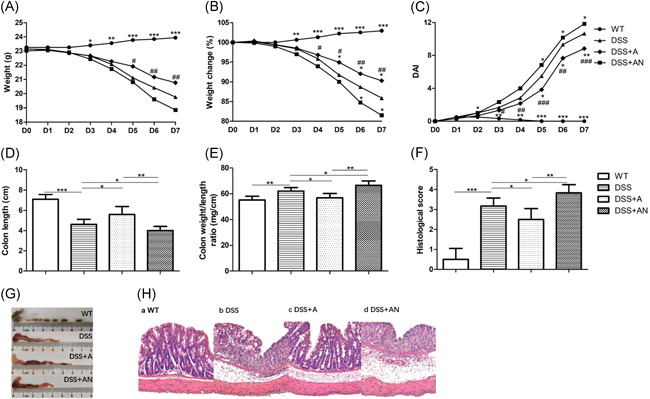
Figure 2.

The effects of miR‐223 agomir and antagomir on DSS‐induced colitis (n = 6/group). (A) The changes of daily weight, (B)The changes of daily weight change, (C) The changes of daily DAI scores (where * indicates the comparison between DSS and WT, DSS + A, DSS + AN group, respectively, # indicates the comparison between DSS + A and DSS + AN group). (D) The changes of colon lengths. (E) The changes of colon weight/length ratios. (F) The changes of histological scores. (G) Representative macroscopic images of colons. (H) Representative micrographs of colon H&E (×200), where *p < .05, **p < .01, ***p < .001, #p < .05, ##p < .01, ###p < .001. DSS, dextran sodium sulfate; miR, microRNA; WT, wild‐type
