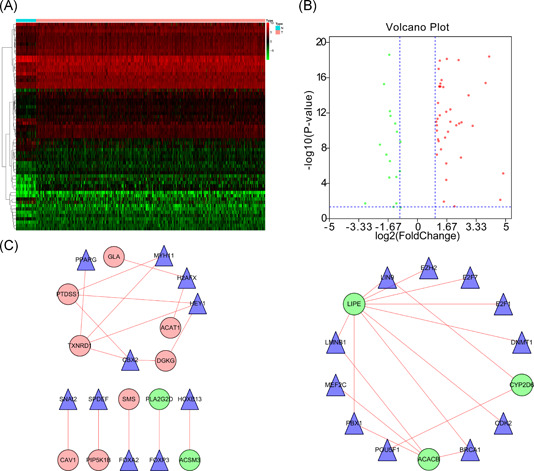
Figure 4.

Transcriptional regulation of lipid metabolism‐related genes. (A) Heatmap of differentially expressed TFs between tumor and matched adjacent normal tissue. (B) Forty‐six upregulated DEGs (red) and 17 downregulated DEGs (green). (C) TFs and prognosis related lipid metabolism genes regulatory network. DEGs, differentially expressed genes; TFs, transcription factors
