Figure 6.

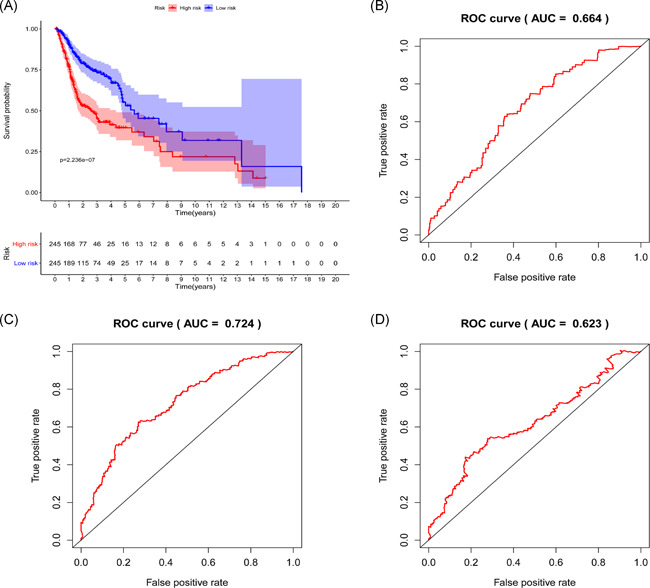
Survival prediction and model validation. (A) Prediction of outcome of stratified patients. (B–D) 1‐, 3‐, and 5‐year AUCs were 0.664, 0.724, and 0.623, respectively. AUC, area under the curve; ROC, receiver operating characteristic

Survival prediction and model validation. (A) Prediction of outcome of stratified patients. (B–D) 1‐, 3‐, and 5‐year AUCs were 0.664, 0.724, and 0.623, respectively. AUC, area under the curve; ROC, receiver operating characteristic