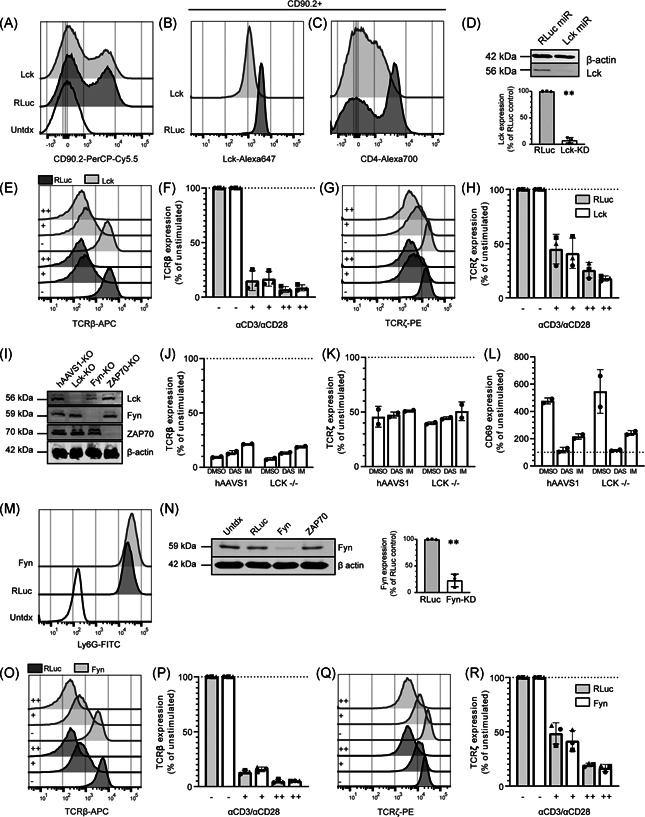
Figure 4.

Lck and Fyn are individually redundant for TCR downregulation in human PBLs. (A–D) Transduction efficiency of nontarget microRNA (dark grey) or Lck microRNA vectors (light grey) was measured by CD90.2 (A) expression, and total Lck (B) and surface CD4 (C) expression was measured within the CD90.2+ population of human PBLs. (D) Lck knockdown was confirmed and quantified with immunoblot (representative example of n = 3 donors). (E–H) Transduced cells were left unstimulated (−), or stimulated with a low (+) or high (++) dose of anti‐CD3/CD28 and surface TCRβ (E, F) and total TCRζ (G, H) was measured. (I) Immunoblots showing the total Lck, Fyn, ZAP70, and β‐actin expression in Jurkat cells (representative example of n = 2). (J–L) Surface TCRβ (J), total TCRζ (K) and surface CD69 (L) expression in Jurkat cells transduced with hAAVS1 or LCK CRISPR vectors stimulated with dimethyl sulfoxide, dasatinib or imatinib. Each symbol represents a separate experiment (n = 2). Expression in nontriggered T cells is set at 100%, based on the MFI. (M) Transduction efficiency of nontarget microRNA (dark grey) or Fyn microRNA vectors (light grey) was measured by Ly6G. (N) Immunoblots showing the total Fyn and β‐actin expression within the Ly6G+ population (representative of n = 3 donors). (O–R) Human PBLs transduced with Fyn microRNAs underwent the same stimulation as described for Lck, and surface TCRβ (O, P) and total TCRζ (Q, R) was measured. (F, H, P, R) Each symbol represents an individual donor (n = 3) examined in a separate experiment. MFI, mean fluorescence intensity; PBL, peripheral blood lymphocyte; TCR, T‐cell receptor. Significance is calculated with the paired Student's t test. **p < .01
