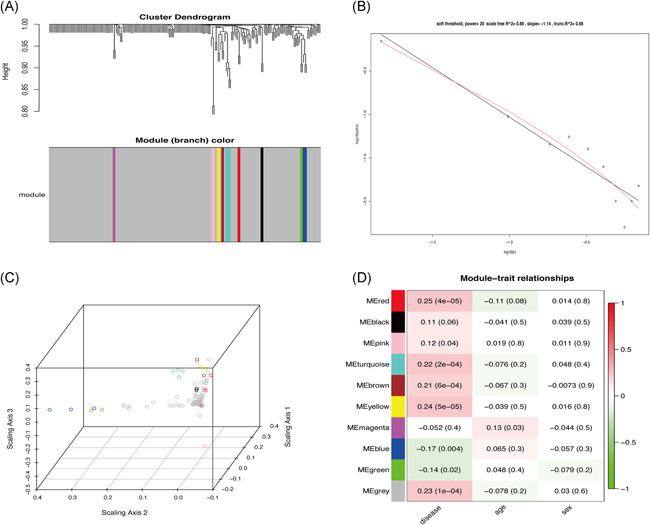
Figure 3.

(A) Cluster analysis of the differentially expressed immune‐related genes data. (Each color represents a module in the gene coexpression network constructed by weighted gene co‐expression network analysis [WGCNA]). (B) Scale‐free fit index of 0.88 when the soft threshold β = 20. (C) Distribution of each WGCNA module. (D) The relationship between each module with disease, age, and sex
